Abstract
The 2003 Medicare Modernization Act (MMA) increased payments to Medicare Advantage plans and instituted a new risk-adjustment payment model to reduce plans' incentives to enroll healthier Medicare beneficiaries and avoid those with higher costs. Whether the MMA reduced risk selection remains debatable. This study uses mortality differences, nursing home utilization, and switch rates to assess whether the MMA successfully decreased risk selection from 2000 to 2012. We found no decrease in the mortality difference or adjusted difference in nursing home use between plan beneficiaries pre- and post the MMA. Among beneficiaries with nursing home use, disenrollment from Medicare Advantage plans declined from 20% to 12%, but it remained 6 times higher than the switch rate from traditional Medicare to Medicare Advantage. These findings suggest that the MMA was not associated with reductions in favorable risk selection, as measured by mortality, nursing home use, and switch rates.
Keywords: Medicare, nursing home care, Medicare Advantage, Medicare Modernization Act, risk selection, mortality
Introduction
In 2015, 55 million people were enrolled in Medicare with 68% in traditional Medicare (TM). However a growing number of Medicare beneficiaries are now insured via private Medicare plans, known as Medicare Advantage (MA) plans. The original rationale for privatization was that capitated payments to risk-bearing plans would strongly incentivize the management of their members' health care costs leading to more efficient provision of care. Initially, private plans were paid by Medicare using a risk adjustment methodology that accounted for age, gender, and welfare status, but not overall health status. This incentivized the enrollment of healthier, lower cost beneficiaries into MA plans (Hellinger & Wong, 2000; Morgan, Virnig, DeVito, & Persily, 1997) a phenomenon known as “risk selection.”
The 2003 Medicare Modernization Act (MMA) made several changes to Medicare plan administration and payments to bolster the role of private risk-bearing plans and decrease favorable risk selection. Experts are divided on the success of the MMA to decrease favorable risk selection (McWilliams, Hsu, & Newhouse, 2012; Rahman, Keohane, Trivedi, & Mor, 2015). Some studies found that there was a successful reduction in overpayments (McWilliams et al., 2012), mortality (Newhouse & McGuire, 2014), and spending (Newhouse, Price, Huang, McWilliams, & Hsu, 2012) between MA and TM enrollees. Others studies have found that there was no reduction in risk selection (Brown, Duggan, Kuziemko, & Woolston, 2014; Morrisey, Kilgore, Becker, Smith, & Delzell, 2013). Importantly, there are some data that switching from MA plans became concentrated among high-cost beneficiaries (Morrisey et al., 2013; Rahman et al., 2015)
This study has three objectives: (1) to evaluate whether the mortality difference between plans has decreased as a result of the MMA, (2) to examine trends in nursing home (NH) care use from 2000 to 2012 immediately prior and after the full implementation of the MMA, and (3) to evaluate switching between TM and MA plans among beneficiaries requiring and not requiring NH care. We hypothesize that despite the MMA, favorable risk selection has not been eliminated when examining mortality differences and switch rates, particularly, in the NH enrollees.
Conceptual Framework
Prior to the Medicare Modernization Act of 2003 capitated monthly payments were made from Centers for Medicare and Medicaid Services (CMS) to private plans. Historically, capitation payments to private plans were linked to traditional Medicare (fee-for-service) expenditures by geographic area. Rates did not account for health status, which resulted in private insurers enrolling healthier beneficiaries. Beneficiaries who cost less than average once adjusting for certain clinical and demographic characteristic disproportionately enrolled in MA rather than TM. This resulted in higher federal spending because payments to private plans were tied to risk-adjusted spending for the average TM beneficiary in the area.
The MMA of 2003 introduced more detailed risk scoring and competitive bidding to address this problem. Key provisions included an adjustment of the payment rate, a restriction of the care provider network, and a lock-in provision. The lock-in provision stipulated that MA enrollees could not switch out of their choice of plans for a year, whereas previously switching could occur monthly. The ability of enrollees to opt out on a monthly basis encouraged favorable risk selection. Members who had a change in health status at any time or required a specific procedure could move to TM, which offered a greater selection of physicians and hospitals. To better predict the future cost of beneficiaries, the new risk adjustment method included a comorbidity index known as hierarchical chronic conditions (HCCs). By 2006, planned bidding replaced the fixed reimbursement rate and the MMA was fully implemented.
The majority of plans now submit bids below the CMS set benchmark rate (Curto, Einav, Levin, & Bhattacharya, 2014). When the plan's bid is below the benchmark, CMS makes a rebate payment to the plan. This rebate can then be used to fund additional benefits such as premium reductions for prescription drug coverage. These additional benefits come at the cost of a restricted health care provider network. The enrollment of healthier beneficiaries would not be problematic, if bidding is sufficiently competitive and resulted in cost savings to beneficiaries, taxpayers, and CMS. However, there is considerable evidence that overpayment to MA plans continues (Curto et al., 2014). The ultimate goal of risk adjustment policy changes is to redirect money away from private plans that enroll healthier (and therefore less costly) enrollees towards plans that care for sicker and more expensive patients. Matching health care resources to needs will be increasingly important given provisions that increase coverage through the Affordable Care Act (ACA).
New Contribution
Prior studies of favorable risk selection in MA have focused on inpatient stays and risk scores based on the HCC algorithm. This evaluation focuses on two novel measures of risk-selection and examines changes over time: NH use and switching from MA to TM following NH use.
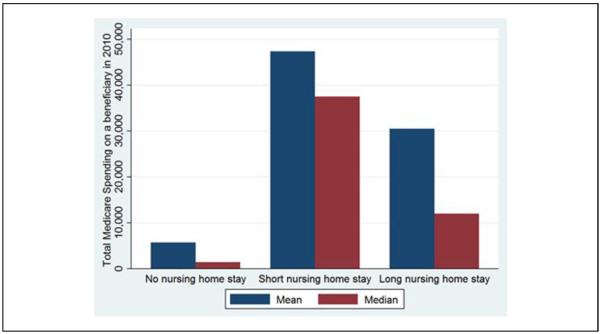
By reviewing Medicare enrollment data and the Minimum Data Set (MDS) we identify temporal trends in NH use between plans (MA vs. TM), as well as switching between these plans. Examining switching rates in this unique medically needy, high-cost population is critical. These individuals are generally high utilizers of medical care and account for a disproportionately high amount of Medicare spending (Grabowski, Stewart, Broderick, & Coots, 2008) (see Appendix). Rates of switching before and after the MMA have been unstudied previously in the NH population and may shed light on the role of NH care in the choice of Medicare (MA vs. TM) plans. Previously, this has been difficult to quantify as the Healthcare Effectiveness Data and Information Set (HEDIS) does not report NH care use directly. Evaluating disenrollment and NH use among beneficiaries will prove relevant as many of the key provisions of the ACA are enacted. Medicare's risk adjustment of MA plans has been suggested as a model for risk adjustment in the ACA's insurance exchanges.
Method
Data Sources
This study uses data from two sources: the Medicare enrollment file for years 2000–2013 and Minimum Data Set (MDS 2.0 and 3.0) for years 2000 to 2012. The Medicare enrollment file contains demographics, date of death, Medicare Advantage (managed care) participation, Part D coverage, and residential state and zip codes. The MDS is a federally mandated assessment tool for all residents in Medicare- or Medicaid-certified nursing facilities. Federal regulations require NHs to complete MDS assessments for each resident at admission and at least quarterly thereafter, for as long as a resident remains in the NH.
Study Cohort
This study analyzes all Medicare beneficiaries aged 65 years or older between 2000 and 2012. In 2000, there were 31 million elderly Medicare beneficiaries with 19% enrolled in MA plans. In 2005, when the MMA was implemented, the number of elderly Medicare beneficiaries was 32 million with 15% enrolled in MA. By 2012, the number of elderly Medicare beneficiaries increased to about 36 million with 28% enrolled in MA.
Variables
Beneficiary Status of MA or TM
An individual was identified as in MA if they were enrolled in an MA plan in January of that year.
Mortality
We defined mortality as a beneficiary who was enrolled in January of a given year but died during that year.
Switching
Switching is defined as whether an enrollee in January of a given year switched from MA to TM (or TM to MA) by the following January. For our switching analysis, we included Medicare beneficiaries aged 65 years or older who were also enrolled in Medicare the following year. Beneficiaries can decide whether to enroll in MA, so any change in enrollment should reflect the beneficiary's decision.
Nursing Home Use
NH care use was determined based on MDS assessments (both 2.0 and 3.0). MDS assessments are completed for all NH patients, both MA and TM beneficiaries. They are completed on admission, discharge, and at least quarterly for beneficiaries with long stays. We categorized beneficiaries based on the length of NH use: long stay, short stay, and no NH use. We defined long-stay NH users as beneficiaries with at least one quarterly or annual MDS assessment during a year, meaning that they were in the facility for at least 90 days. (Intrator, Zinn, & Mor, 2004; Lau, Kasper, Potter, Lyles, & Bennett, 2005; Rahman et al., 2014). Individuals were considered short-stay NH users if they had at least one MDS assessment, but not a quarterly or annual one. Thus, any individual who had a separate short- and long-stay NH episode in a given year was considered a long-stay NH user. Individuals without an MDS assessment were categorized as not having an NH stay.
Control Variables
In our multivariate analysis, we controlled for age, sex, race, and county of residence for the Medicare beneficiary. This was obtained from the enrollment data.
Analysis
For each of our three outcome variables, mortality, NH use, and switching, we performed two types of analyses. First, we plotted outcomes over time separately for MA and TM beneficiaries. More specifically, we plotted the share of MA and TM enrollees in January of a given year that experienced the relevant outcome in that year. For the switching outcome, following Rahman et al. (2015), we performed separate analyses for beneficiaries with and without NH use.
Second, we plotted differences in outcomes between MA and TM beneficiaries with estimates adjusted for the control variables listed above and market fixed effects. We estimated these differences separately for each year. Annual differences in outcomes show whether pre- and post-MMA differences are due to the MMA or some preexisting trend.
For mortality and switching, we used a linear probability model that included age, sex, race, and county fixed effect. The main explanatory variable was an indicator of MA enrollment in January. The coefficient associated with the MA indicator captures the difference in outcomes. Since NH use is a three-category outcome, we used a multinomial logit model that included the MA enrollment indicator, age, sex, race, and state fixed effects. We then estimated the marginal effects of MA enrollment and plotted the marginal effects. We used a 20% random sample for multinomial logit models because it is computationally intensive.
Results
Mortality Differences Between Plans
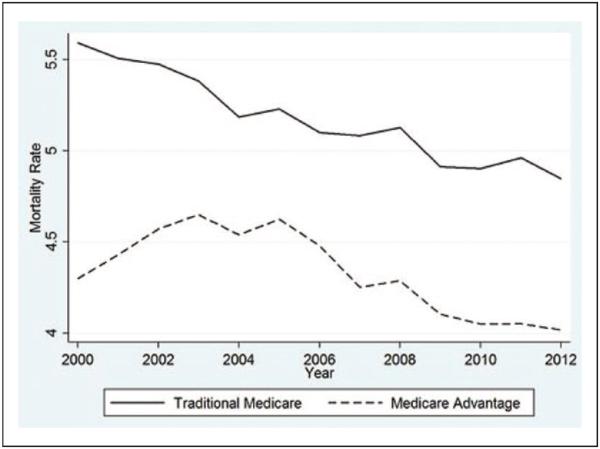
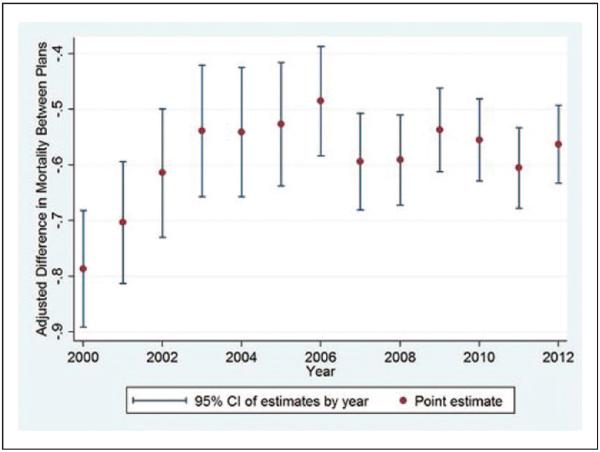
Figures 1 and 2 show temporal trends in the percent of MA and TM enrollees who died in the corresponding year. Overall there was a decrease in the mortality rate of beneficiaries in both plans as seen in Figure 1. At all times, the mortality rate of TM enrollees was higher than MA enrollees. Figure 2 shows the adjusted difference in mortality rate between MA and TM enrollees. In 2000, MA enrollees were about 0.8 percentage points less likely to die than TM enrollees. Between 2001 and 2003, prior to the implementation of the MMA, there was a small decline in the mortality difference of beneficiaries between plans. During the post-MMA years difference in mortality remained constant at 0.6 percentage points. Overall, a mortality difference between TM and MA enrollees continues to exist in the most recent year of the study - 2012.
Figure 1.
Trends in adjusted mortality rates in traditional Medicare and Medicare Advantage, 2000-2012.
Figure 2.
Adjusted difference between traditional Medicare and Medicare Advantage enrollees in the proportion that died by the end of an enrollment year.
Note. Differences are estimated adjusting for age, sex, race, and county fixed effects.
Nursing Home Use
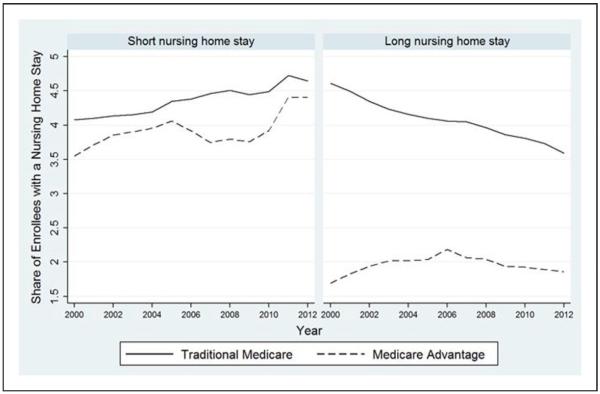
In 2000, approximately 8.5% of TM beneficiaries used NH care (Figure 3) with 4% having a short and 4.5% having a long NH stay. By 2012, more TM beneficiaries had a short NH stay than a long NH stay (4.5% vs. 3%). Short NH stays increased and long NH stays decreased among TM beneficiaries over the period analyzed. Among MA beneficiaries NH use increased overall from 5% in 2000 to 6% in 2006 with a small decline and leveling off after the MMA. Short NH use increased in MA beneficiaries from 3.5% to 4.5% between 2000 and 2012, while long NH stays remained steady in the same period at about 2%.
Figure 3.
Share of traditional Medicare and Medicare Advantage beneficiaries with a nursing home stay.
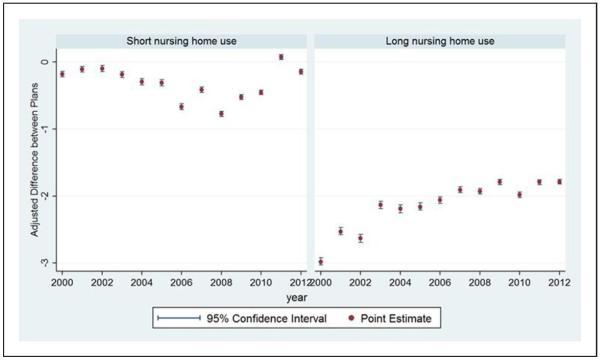
A considerably smaller proportion of MA enrollees had long NH stays compared with TM enrollees as demonstrated in Figure 4, right panel. MA enrollees were about 3 percentage points less likely to have long NH use than TM enrollees in 2000. This difference shrunk during the following 12 years. However, in general, the adjusted difference in long-stay NH use rates were significantly different for TM and MA enrollees with more TM beneficiaries having long NH stays from 2000-2012. The adjusted difference between plans in short NH use increased from 2002 to 2008 and then decreased (Figure 4, left panel). Overall, more TM enrollees had short-term and long-term NH use in the period analyzed.
Figure 4.
Adjusted difference in nursing home use rates between traditional Medicare and Medicare Advantage beneficiaries before and after the Medicare Modernization Act.
Note. Differences are estimated adjusting for age, sex, race, and county fixed effects.
Switching Rates Among Nursing Home Beneficiaries
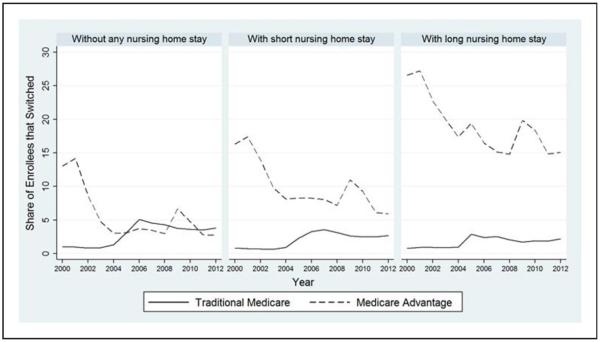
Figure 5 shows switch rates of enrollees without any NH stay and with a short or long NH stay. In 2000, 13% of MA enrollees without any NH stay switched to TM (Figure 5, left panel). There was a decline in exiting MA during the time when MMA policies were implemented from 2003 to 2005 by 10 percentage points. At the same time TM enrollees without any NH stay became more likely to switch to MA. Switching in this group increased from 1% pre-MMA to 5% immediately after the MMA implementation in 2006. After 2005, switching out of TM or MA leveled off. In 2012 enrollees without NH use exited their plans at a rate of 4% annually (Figure 5, left panel). This number was the same regardless of which plan they were in the prior year.
Figure 5.
Share of traditional Medicare and Medicare Advantage beneficiaries who switched by the following year (switch rate).
As seen in the middle panel, 16% of individuals in MA who had a NH stay in 2000 left their plan. There was a steady decline in exiting MA until 2008 when MA plan exits reached 7%. From 2008 to 2012 there was an increase then decrease in plan exits by MA enrollees. By the end of the period analyzed 6% of MA enrollees exited their plans. TM enrollees with a short NH stay were unlikely to switch to MA with exiting out of TM at 1% from 2000 to 2003. After the MMA from 2003 to 2012 there was an increase in switching out of TM and into MA to 2.5%. Enrollees with a long NH stay followed a similar trend (Figure 5, right panel). Plan exits from TM were low with 1% exiting from 2000 to 2004 and 2.5% exiting from 2004 to 2012. However, switch rates out of MA were high with 26.5% of enrollees with long NH stays exiting MA in 2000. There was a steady decline until plan exits of MA enrollees with long NH stays reached 15% in 2008. In 2008, there was an increase then decrease in plan exits from MA and then by 2012, 15% exited their plans.
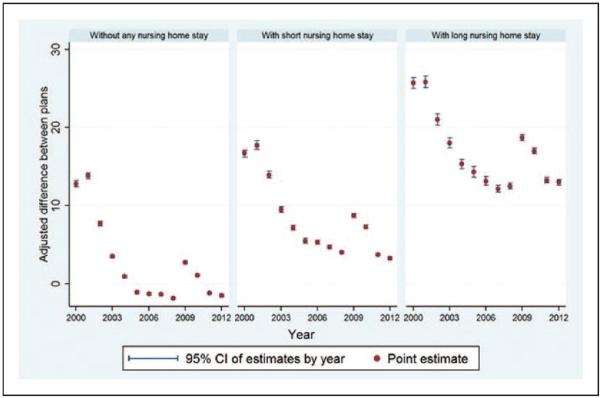
The adjusted difference in switch rates among beneficiaries without any NH use became statistically zero by 2012 (Figure 6, left panel). However, more MA beneficiaries with NH use were switching out of their plans than TM enrollees (Figure 6, middle and right panels). The adjusted difference in switch rates between MA and TM remains the largest for beneficiaries with long NH use (Figure 6, right panel).
Figure 6.
Adjusted difference in switch rates between traditional Medicare and Medicare Advantage beneficiaries.
Note. Differences are estimated adjusting for age, sex, race, and county fixed effects.
Discussion
We examined temporal trends in mortality differences, NH use, and switch rates between MA and TM from 2000-2012. We found no decrease in the mortality difference or adjusted difference in NH use between plan beneficiaries immediately prior and post the MMA. By 2012, plan exits were the same for TM and MA enrollees in those that did not have an NH stay, but beneficiaries that required NH care in the prior year were far more likely to switch out of MA and into TM despite the MMA policies. This trend was particularly prominent in enrollees with the most costly long NH stays. Our findings that high-cost patients such as NH patients and those near the end-of-life are more likely to switch out of MA suggest that favorable risk selection still occurs in the Medicare market.
Our analysis showed narrowing of the mortality difference between MA and TM beneficiaries immediately prior to the MMA policies being implemented in the years 2003–2006. Newhouse et al. compared MA and TM beneficiaries' mortality in the years 1998 and 2008 and concluded that mortality rates narrowed between plans over time as a result of the MMA (Newhouse et al., 2012). However, our analysis shows that while the mortality difference narrowed when comparing data from the years 2000 to 2012, this narrowing preceded the MMA. Figure 2 exemplifies this. Newhouse et al. (2012) postulated that the MMA was instrumental in decreasing the mortality difference. Our analysis shows that the mortality difference narrowed in years 2000 to 2003 before the MMA was implemented and the mortality difference remained stable from 2003 to 2012 during and after the implementation of the MMA. Despite the MMA policies TM beneficiaries continue to be a higher risk group than enrollees in MA, which should be considered in the risk adjustment methodology used to determine Medicare payments.
Our analysis suggests that disenrollment may be driven by NH use in the prior year. We found that while in the most recent year studied there was no difference in switch rates between enrollees without NH use, a far greater share of MA enrollees are switching out of their plans when they had an NH stay in the prior year. There are multiple reasons why beneficiaries who required an NH stay may exit their plans. MA plans may lack experience in delivering high-quality postacute and long-term care. There may be particular benefits that MA plans cannot provide to the NH population, which may make these plans less attractive. Cost-sharing for skilled nursing care is often higher in MA plans than in the traditional Medicare program. Additionally, network restrictions may make it difficult for NH beneficiaries to access necessary physicians, creating an incentive to switch. Policy makers should consider implementing a separate reimbursement scheme for these high-cost beneficiaries to retain NH users in their plans.
Further understanding of how seniors make choices regarding health care coverage and how NH use influence disenrollment is crucial. Which insurance plans seniors choose has important ramifications for their access to care, out-of-pocket spending, and Medicare costs. In a recent article by Reid et al. enrollment decisions in Medicare plans were predicted predominantly by the MA plan's market share (35%), premium and out-of-pocket spending (25% and 12%, respectively), and star ratings (14%; Reid, Deb, Howell, Conway, & Shrank, 2016; Trivedi, 2016).
MA plans are incentivized to have high-cost, high-need beneficiaries leave their plans. Morrissey et al. examined the relative costliness of beneficiaries switching out of MA and returning to TM. Claims expenditures in the 6 months after returning were 151% of nonswitchers in 2008, suggesting that those disenrolling from MA were a high expenditure group of beneficiaries (Morrisey et al., 2013). Jacobson et al. evaluated switching behaviors from 2006 to 2011. They found that dual eligibles and beneficiaries younger than 65 years with disabilities disenrolled from MA at higher-than-average rates. However, lower cost individuals preferentially selected MA plans. Forty-eight percent of new MA enrollees were newly eligible Medicare beneficiaries. Additionally, relatively younger beneficiaries aged 65 to 69 years switched from TM to MA at higher-than-average rates (Jacobson, Neuman, & Damico, 2015). MA plans can enroll relatively healthier beneficiaries in their plans by using several strategies: restricting the physician network to physicians to better contain costs, specifying drug formularies and benefits, making strategic marketing choices, as well as focusing on geographic locations that incur less costs (Cooper & Trivedi, 2012; Newhouse, Price, McWilliams, Hsu, & McGuire, 2015).
Switching out of MA by high-cost enrollees may occur for several reasons. Prior research by Rahman et al. suggest that MA members who use home health or nurse home services may find that network restrictions make it more difficult to access these services than in traditional Medicare (Rahman et al., 2015). Additionally prior to 2011 some MA plans imposed high cost sharing for services such as skilled nursing facility care, increasing out-of-pocket costs for seriously ill beneficiaries. Regulations took effect in January 2011 that capped out-of-pocket expenses and may reduce MA enrollees' willingness to exit their plans (Medicare Program; Policy and Technical Changes to the Medicare Advantage and the Medicare Prescription Drug Benefit Programs, 2010).
This article has several limitations. First, we were unable to control for beneficiaries' clinical condition. Several studies have used HCC score that determined CMS payment rate to MA plans for a representative enrollee (Curto et al., 2014; Newhouse et al., 2013; Newhouse & McGuire, 2014). These studies also computed HCC score for traditional Medicare beneficiaries using the prior claims data. We do not have data to calculate these HCC scores. Based on the findings of Curto et al. (2014) our mortality gap is underestimated. Of note, these studies are mostly cross sectional. Tracking chronic conditions of a Medicare beneficiary improved over time and as a result the quality of HCC score as a measure of patient acuity may have improved over time. Thus, inclusion of HCC score in our model would have increased the mortality gap over time simply because of higher accuracy of HCC score. In such a case, the omission of this clinical measure might be desirable.
Conclusions
We found consistently lower mortality rates in MA relative to TM following the MMA's implementation of increased payment rates and an enhanced risk-adjusted payment model. The MMA policies were associated with decreased rates of switching out of plans for MA beneficiaries. However, MA beneficiaries using NH services continued to have high rates of switching out of MA plans into TM. Further policies to decrease the exiting of NH beneficiaries from MA plans are necessary.
Acknowledgments
The grant funders played no role in the design, analysis, or interpretation of the data. The views expressed in this article are those of the authors and do not necessarily represent the position or policy of the Department of Veterans Affairs or the U.S. government.
Funding The author(s) disclosed receipt of the following financial support for the research, authorship, and/or publication of this article: Dr. Goldberg received research funding for this work from the Center of Gerontology and Healthcare Research, Brown University, AHRQ T32 postdoctoral training grant (Principal Investigator: Mor, Grant No. T32 HS000011). Additionally, this work was supported by the National Institute on Aging (Grant Nos. R01 AG047180-01, P01 AG027296, and R01AG044374-01).
Appendix
Figure A1.
Total Medicare spending on fee-for-service beneficiaries in 2010
Note. This figure is based on a 20% random sample of Medicare beneficiaries who were enrolled in a traditional fee-for-service plan for the entirety of 2010. It includes both part A and part B spending.
Footnotes
Declaration of Conflicting Interests The author(s) declared no potential conflicts of interest with respect to the research, authorship, and/or publication of this article.
References
- Brown J, Duggan M, Kuziemko I, Woolston W. How does risk selection respond to risk adjustment? New evidence from the Medicare Advantage Program. American Economic Review. 2014;104:3335–3364. doi: 10.1257/aer.104.10.3335. [DOI] [PubMed] [Google Scholar]
- Cooper AL, Trivedi AN. Fitness memberships and favorable selection in Medicare Advantage plans. New England Journal of Medicine. 2012;366:150–157. doi: 10.1056/NEJMsa1104273. [DOI] [PMC free article] [PubMed] [Google Scholar]
- Curto J, Einav L, Leven J, Bhattacharya J. Can health insurance competition work? Evidence from Medicare Advantage. National Bureau of Economic Research; Cambridge, MA: 2014. (National Bureau of Economic Research Working Paper Series 20818). [Google Scholar]
- Grabowski DC, Stewart KA, Broderick SM, Coots LA. Predictors of nursing home hospitalization: A review of the literature. Medical Care Research and Review. 2008;65:3–39. doi: 10.1177/1077558707308754. [DOI] [PubMed] [Google Scholar]
- Hellinger FJ, Wong HS. Selection bias in HMOs: A review of the evidence. Medical Care Research and Review. 2000;57:405–439. doi: 10.1177/107755870005700402. [DOI] [PubMed] [Google Scholar]
- Intrator O, Zinn J, Mor V. Nursing home characteristics and potentially preventable hospitalizations of long-stay residents. Journal of American Geriatrics Society. 2004;52:1730–1736. doi: 10.1111/j.1532-5415.2004.52469.x. [DOI] [PubMed] [Google Scholar]
- Jacobson GA, Neuman P, Damico A. At least half of new Medicare advantage enrollees had switched from traditional Medicare during 2006–11. Health Affairs. 2015;34:48–55. doi: 10.1377/hlthaff.2014.0218. [DOI] [PubMed] [Google Scholar]
- Lau DT, Kasper JD, Potter DE, Lyles A, Bennett RG. Hospitalization and death associated with potentially inappropriate medication prescriptions among elderly nursing home residents. Archives of Internal Medicine. 2005;165:68–74. doi: 10.1001/archinte.165.1.68. [DOI] [PubMed] [Google Scholar]
- McWilliams JM, Hsu J, Newhouse JP. New risk-adjustment system was associated with reduced favorable selection in medicare advantage. Health Affairs. 2012;31:2630–2640. doi: 10.1377/hlthaff.2011.1344. [DOI] [PMC free article] [PubMed] [Google Scholar]
- Medicare Program Policy and Technical Changes to the Medicare Advantage and the Medicare Prescription Drug Benefit Programs. Final rule. 2010. Fed. Reg. 2010;75(72):19677–826. [PubMed] [Google Scholar]
- Morgan RO, Virnig BA, DeVito CA, Persily NA. The Medicare-HMO revolving door—The healthy go in and the sick go out. New England Journal of Medicine. 1997;337:169–175. doi: 10.1056/NEJM199707173370306. [DOI] [PubMed] [Google Scholar]
- Morrisey MA, Kilgore ML, Becker DJ, Smith W, Delzell E. Favorable selection, risk adjustment, and the Medicare Advantage program. Health Services Research. 2013;48:1039–1056. doi: 10.1111/1475-6773.12006. [DOI] [PMC free article] [PubMed] [Google Scholar]
- Newhouse JP, McGuire TG. How successful is Medicare Advantage? Milbank Quarterly. 2014;92:351–394. doi: 10.1111/1468-0009.12061. [DOI] [PMC free article] [PubMed] [Google Scholar]
- Newhouse JP, McWilliams JM, Price M, Huang J, Fireman B, Hsu J. Do Medicare Advantage plans select enrollees in higher margin clinical categories? Journal of Health Economics. 2013;32:1278–1288. doi: 10.1016/j.jhealeco.2013.09.003. [DOI] [PMC free article] [PubMed] [Google Scholar]
- Newhouse JP, Price M, Huang J, McWilliams JM, Hsu J. Steps to reduce favorable risk selection in medicare advantage largely succeeded, boding well for health insurance exchanges. Health Affairs. 2012;31:2618–2628. doi: 10.1377/hlthaff.2012.0345. [DOI] [PMC free article] [PubMed] [Google Scholar]
- Newhouse JP, Price M, McWilliams JM, Hsu J, McGuire TG. How much favorable selection is left in Medicare Advantage? American Journal of Health Economics. 2015;1:1–26. doi: 10.1162/AJHE_a_00001. [DOI] [PMC free article] [PubMed] [Google Scholar]
- Rahman M, Gozalo P, Tyler D, Grabowski DC, Trivedi A, Mor V. Dual eligibility, selection of skilled nursing facility, and length of Medicare paid postacute stay. Medical Care Research and Review. 2014;71:384–401. doi: 10.1177/1077558714533824. [DOI] [PMC free article] [PubMed] [Google Scholar]
- Rahman M, Keohane L, Trivedi AN, Mor V. High-cost patients had substantial rates of leaving Medicare advantage and joining traditional Medicare. Health Affairs. 2015;34:1675–1681. doi: 10.1377/hlthaff.2015.0272. [DOI] [PMC free article] [PubMed] [Google Scholar]
- Reid RO, Deb P, Howell BL, Conway PH, Shrank WH. The roles of cost and quality information in Medicare advantage plan enrollment decisions: An observational study. Journal of General Internal Medicine. 2016;31:234–241. doi: 10.1007/s11606-015-3467-3. [DOI] [PMC free article] [PubMed] [Google Scholar]
- Trivedi AN. Understanding seniors' choices in Medicare Advantage. Journal of General Internal Medicine. 2016;31:151–152. doi: 10.1007/s11606-015-3511-3. [DOI] [PMC free article] [PubMed] [Google Scholar]


