
Figure 3.
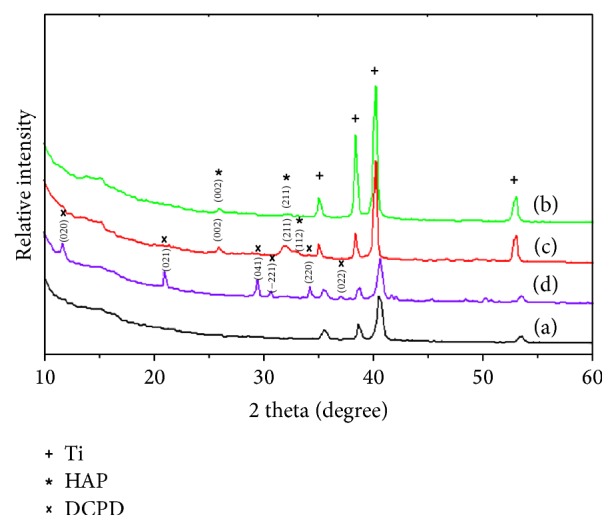
XRD pattern of the bare Ti implant specimen (a) and of the specimens coated with CaP at different electrolytic concentrations: group 10−4 (b); group 10−3 (c); and group 10−2 (d).
Official websites use .gov
A
.gov website belongs to an official
government organization in the United States.
Secure .gov websites use HTTPS
A lock (
) or https:// means you've safely
connected to the .gov website. Share sensitive
information only on official, secure websites.
XRD pattern of the bare Ti implant specimen (a) and of the specimens coated with CaP at different electrolytic concentrations: group 10−4 (b); group 10−3 (c); and group 10−2 (d).