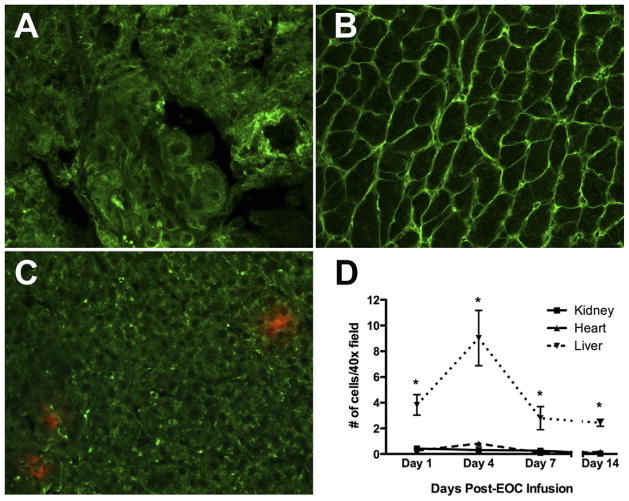
Figure 2.
After infusion of 1 × 10⁶ fluorophore-labeled EOCs, very few cells could be found in the kidney despite dramatic structural and functional benefits, whereas cells were found in the liver. (A–C) Representative confocal microscopy images of kidney, heart, and liver, respectively, at 4 days after EOC infusion. Original magnification, ×20. (A) Kidney cortex. (B) Heart. (C) Liver. (D) Time-course of EOC retention in kidney, heart, and liver. n = 3 animals per time point. *P< .05 versus kidney.
Adapted from Yuen DA et al.18

