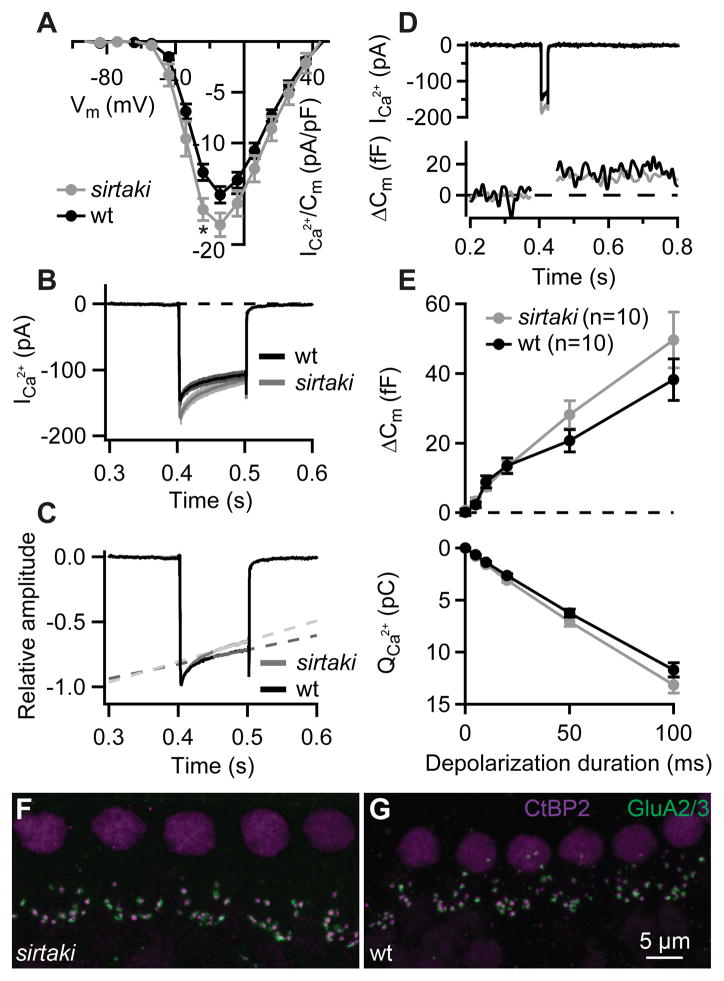
Figure 3. Synaptic function of IHCs is preserved in sirtaki mice carrying a C-terminal deletion in pejvakin.
(A) Current-voltage relationship of the voltage-gated Ca2+ current normalized to the cell membrane capacitance in sirtaki (grey; n = 10) and wild-type control (black; n = 10) IHCs from 2–3-week-old mice. In the mutant IHCs Ca2+ current densities were slightly larger (*, Student’s t-test, p = 0.02). (B–C) Absolute (B) and normalized (C) Ca2+ currents in response to 100-ms depolarizations to the peak Ca2+ current potential. Note a stronger Ca2+-current inactivation in the mutant IHCs. In 100 ms, Ca2+ current was reduced for 23 ± 1 and 30 ± 2% in wild-type (n = 10) and mutant (n = 10) IHCs, respectively (calculated as the ratio of the final and initial calcium current amplitude, Ifinal/Iinitial; p = 0.005, Student’s t-test). The slope of the linear fit (1/s) to the Ca2+ currents in wild-type (n = 10) and mutant (n = 10) IHCs had a value of 1.1 ± 0.1 and 1.6 ± 0.1, respectively (p = 0.002, Student’s t-test). (D) Representative Ca2+ currents (top) and membrane capacitance (Δ Cm) responses (bottom) evoked by 20-ms depolarization to peak Ca2+ current potential. (E) Exocytosis (Δ Cm, top) and the corresponding Ca2+ current integrals (QCa, bottom) as a function of duration of depolarizations to the peak Ca2+ current potential. The Cm increases and QCa are comparable in the mutant (grey) and the wild-type (black) IHCs (p > 0.05, Student’s t-test and Wilcoxon rank-sum test). All responses are given as grand averages (calculated from the means of the individual cells) ± S.E.M. (F–G) Confocal images of whole-mounts of organs of Corti double stained for the presynaptic marker CtBP2/Ribeye (magenta) and postsynaptic marker GluA 2/3 (green). The number of synapses in mutant IHCs (F) was comparable to that of wild-type IHCs (G), however in total we observed fewer ribbons and fewer GluA receptor immunospots (see Table 1).

