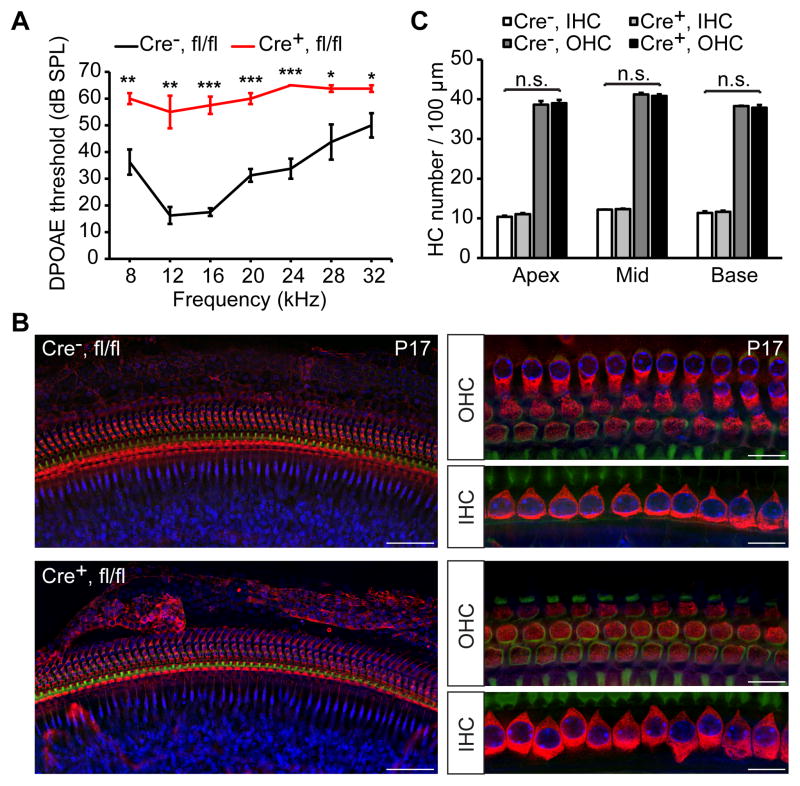
Figure 6. Analysis of DPOAEs in Prestin-CreERT2; PjvkCKO mice.
(A) Average DPOAE thresholds at different frequencies in tamoxifen-treated Prestin-CreERT2+/− Pjvkfl/fl mice (Cre+, fl/fl; red) and Prestin-CreERT2-/− Pjvkfl/fl littermates (Cre−, fl/fl; black) at P17. Data are presented as mean ± SEM. *p < 0.05, **p < 0.01, ***p < 0.001, (Student’s t-test, n = 4 mice per group). (B) Whole-mount surface views at low (left panels) and high magnification (right panels) of the base of a Cre-positive (Cre+, fl/fl) and Cre-negative (Cre+, fl/fl) Prestin-CreERT2 Pjvkfll/fl cochlea at P17 immunolabeled with myosin VIIa antibody. (C) Quantification of hair cell numbers at P17 shows no significant changes in the density of OHCs in cochlea of Cre-positive (Cre+) and Cre-negative (Cre−) Prestin-CreERT2 Pjvkfll/fl mice. Data are mean ± SEM (n = 3 cochleae from different mice per group; p > 0.05; Student’s t-test).

