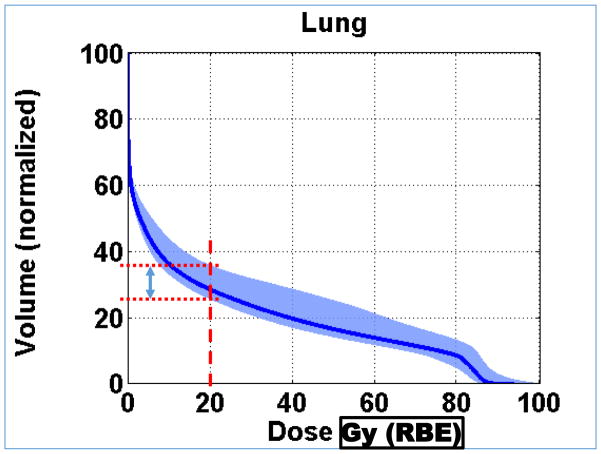
Figure 16.
Normal lung (i.e., Lung – CTV) dose volume histograms for a NSCLC IMPT plan optimized based on conventional (i.e., PTV-based) criteria. The blue band represents nine different dose distributions. Six of them were obtained by shifting the patient (i.e., the CT image) along +/− x, y and z directions by margins typically assigned for positioning uncertainty. Two more were obtained by scaling the CT numbers so that the range of protons is increased or decreased by the estimated uncertainty in range. The ninth dose distribution is the nominal dose distribution without considering any uncertainty. Its corresponding lung DVH is represented by the dark blue line. During optimization, the volume receiving 20 Gy (RBE) is constrained to within 37% of the total lung volume. The width of the band at 20 Gy (RBE) along the volume axis is a measure of the robustness of this critical dose-volume index for lung. The worst case DVH will be the upper bound of the band. (Adapted from Liu, et al.[64])

