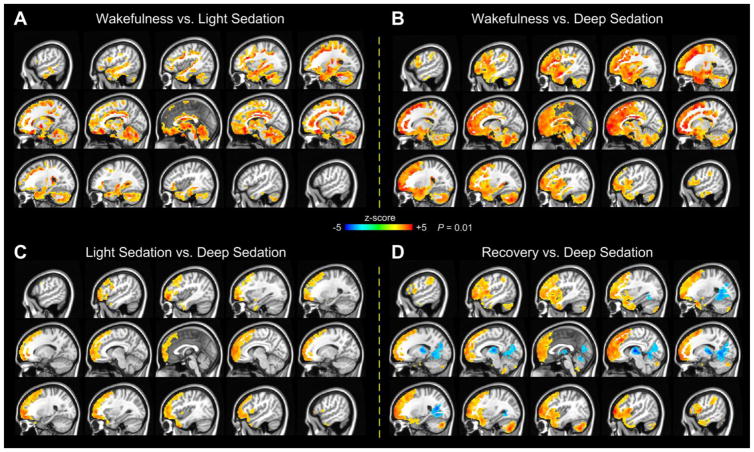
Fig. 2.
Two-sided one-sample paired t-tests of fALFF between wakefulness and light sedation (A), between wakefulness and deep sedation (B), between light sedation and deep sedation (C), and between recovery and deep sedation (D). Warm colors indicate higher fALFF in the first state of each paired comparison. The significance of results is reported at P = 0.01, corrected for multiple comparisons.

