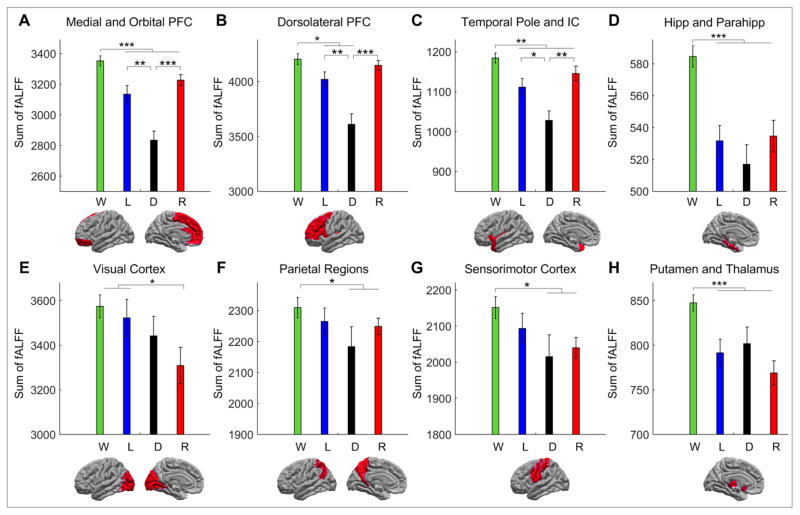
Fig. 3.
Region-specific changes in the sum of fALFF across the four states of consciousness in wakefulness (W), light sedation (L), deep sedation (D), and recovery (R). Paired t-test comparisons that show a main effect of difference are marked by an asterisk. Error bars represent the standard error of measurement. (* denotes p<=0.05; ** p<=0.01; and *** p<=0.001. PFC: prefrontal cortex; IC: insular cortex; Hipp: hippocampus; Parahipp: parahippocampal gyrus)

