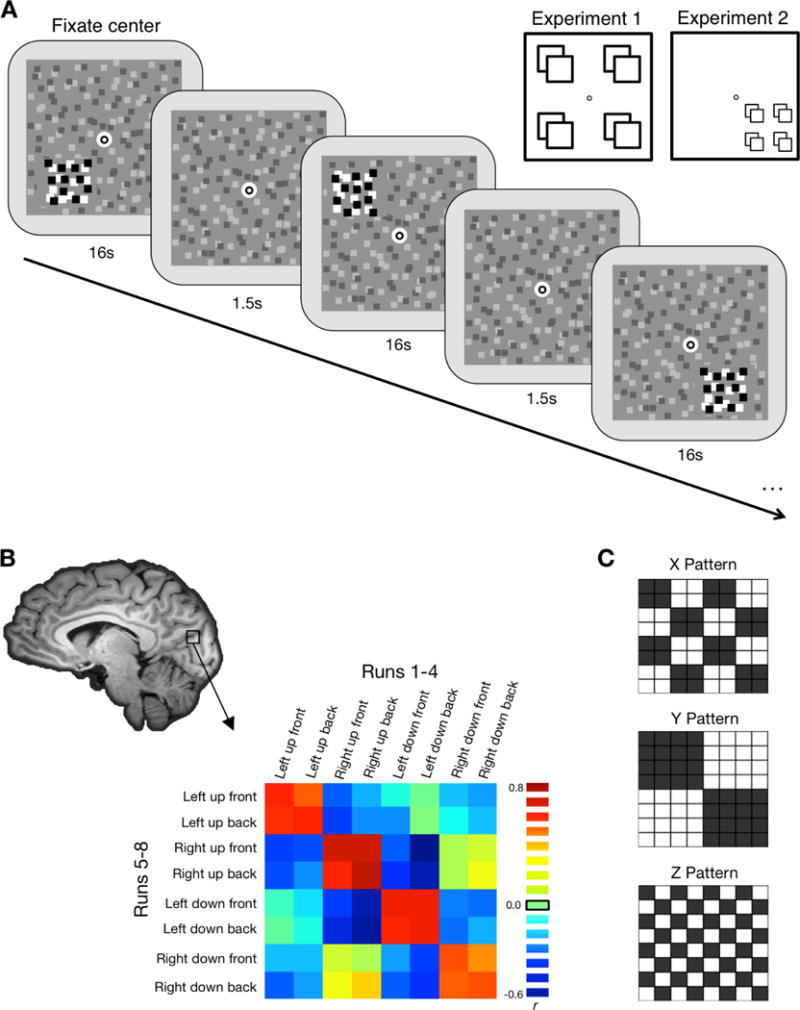
Figure 1.

A, Schematic illustration of the stimuli. Stimuli were high contrast dynamic random dot patterns on a lower contrast static random dot background. Stimuli were presented in a block design, with two blocks per each of the eight location conditions per run. Each block lasted 16 s with 1.5 s between each block. Participants performed a dot-dimming task at fixation, pressing a button whenever the fixation dot flashed black. Inset illustrates the possible stimulus locations. For Experiment 1 locations were either to the left or right of fixation, above or below fixation, and in front of or behind fixation. In Experiment 2 all stimulus locations were in the lower right quadrant of the display; X and Y distances were smaller, but Z distance was the same as Experiment 1. B, Correlation matrices were created for each searchlight or ROI (shown here: actual data from Experiment 1 V7). This matrix is created by correlating the voxel-wise pattern of response for each of the 8 conditions in the first half of the session with each of the 8 conditions in the second half. The red-green 3D glasses were flipped halfway through the session. C, Matrices illustrate hypothetical correlation patterns for pure X, Y, and Z location information. For each dimension, we transformed the correlations to z-scores and quantified the amount of location information by subtracting the difference between same-location comparisons (black) and different-location comparisons (white).
