
Figure 3.
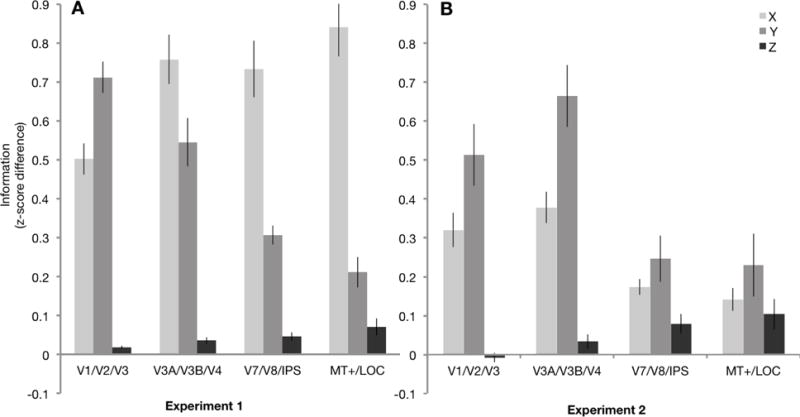
A, Average X, Y, and Z location information within each ROI group for Experiment 1 (N=11) and B, Experiment 2 (N=12). Experiment 2 data is shown for the left (contralateral) hemisphere only; data from individual ROIs, including the ipsilateral right hemisphere, are in Figures S4 & S5. Error bars represent SEM.