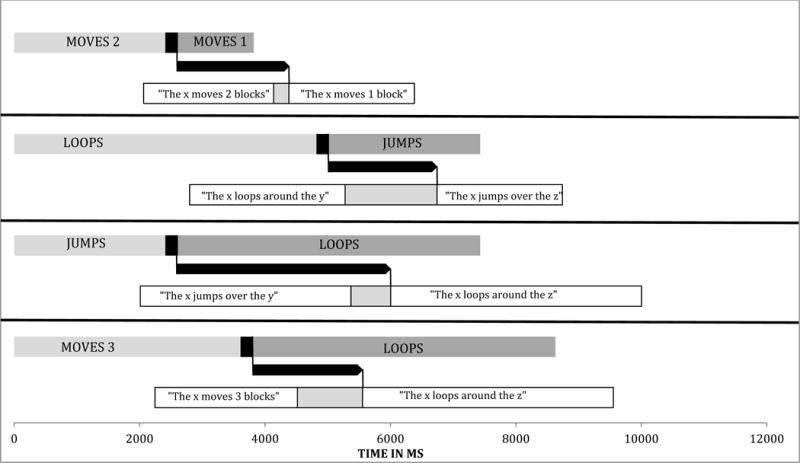
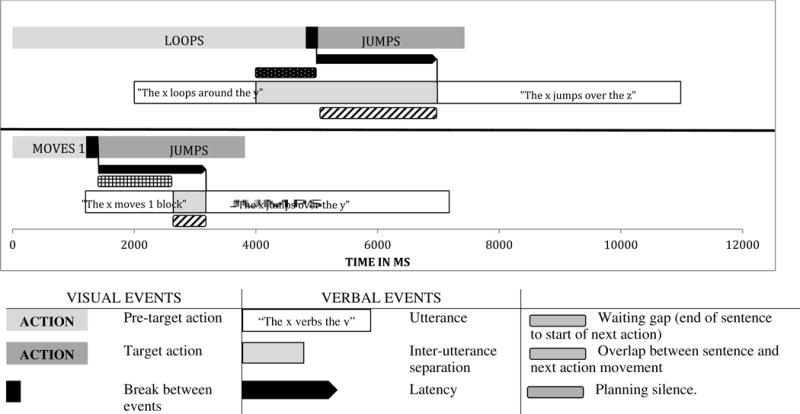
Figure 3.


Illustration of timing variables. Top panel illustrates the typical timing of consecutive action descriptions in this database. For each pair, the shaded bars illustrate the duration of the stimulus actions, and the black separator illustrates the 200 msec between actions. These times are fixed. The open bars illustrate average onset and duration of the description for each movement, and the light shaded bar represents the average inter-utterance separation (i.e. “planning silence”) for the shown verb pairs3. Note that the duration of utterance 2 was not coded, and is only estimated here. Bottom panel illustrates gap, planning silence, and overlap measures (utterance times here are examples and not averages).
