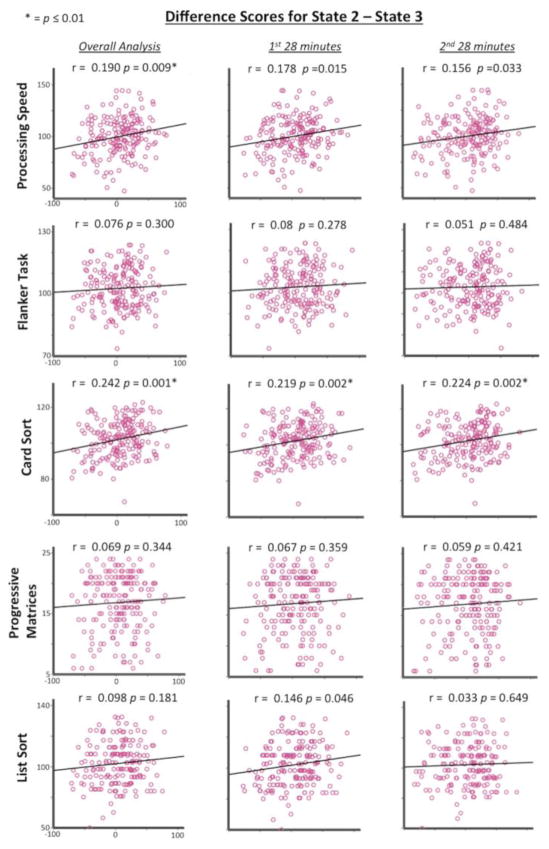
Figure 4. Frequency of occurrence difference scores.
State 2 minus state 3 (x axis) correlated with behavioral performance (y axis) for the overall, first-half, and second-half analyses for all 189 subjects. Greater difference scores are positively correlated with better performance on the Card Sort task for all three analyses.

