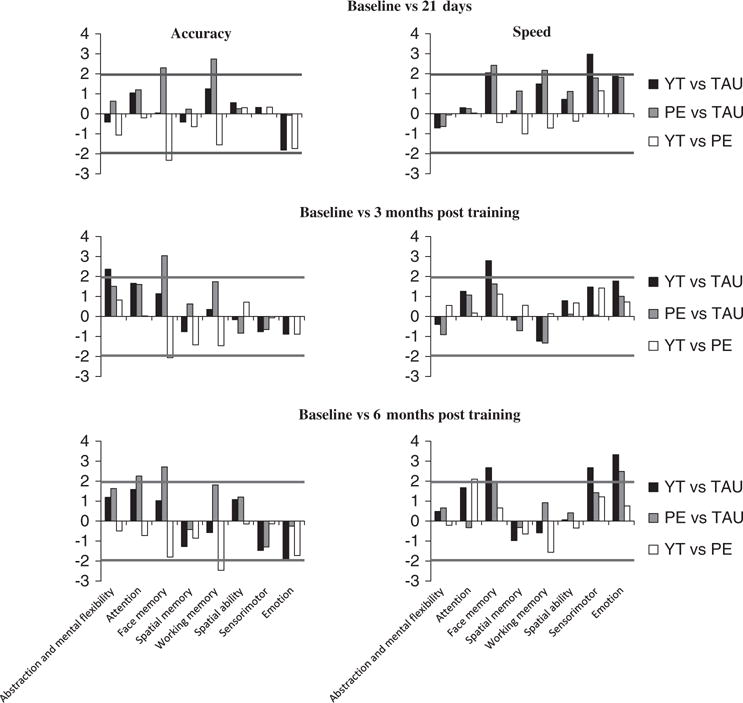
Fig. 2.

Comparisons of changes in cognitive domain scores from baseline between pairs of intervention groups. The X axis shows individual cognitive domains, with accuracy measures on the left and speed measures on the right. The Y axis shows t-values while comparing pairs of treatment groups. The statistical significance level is indicated by a horizontal line at 1.96. PE, supervised physical exercise training with TAU; TAU, treatment as usual; YT, supervised yoga training with TAU.
