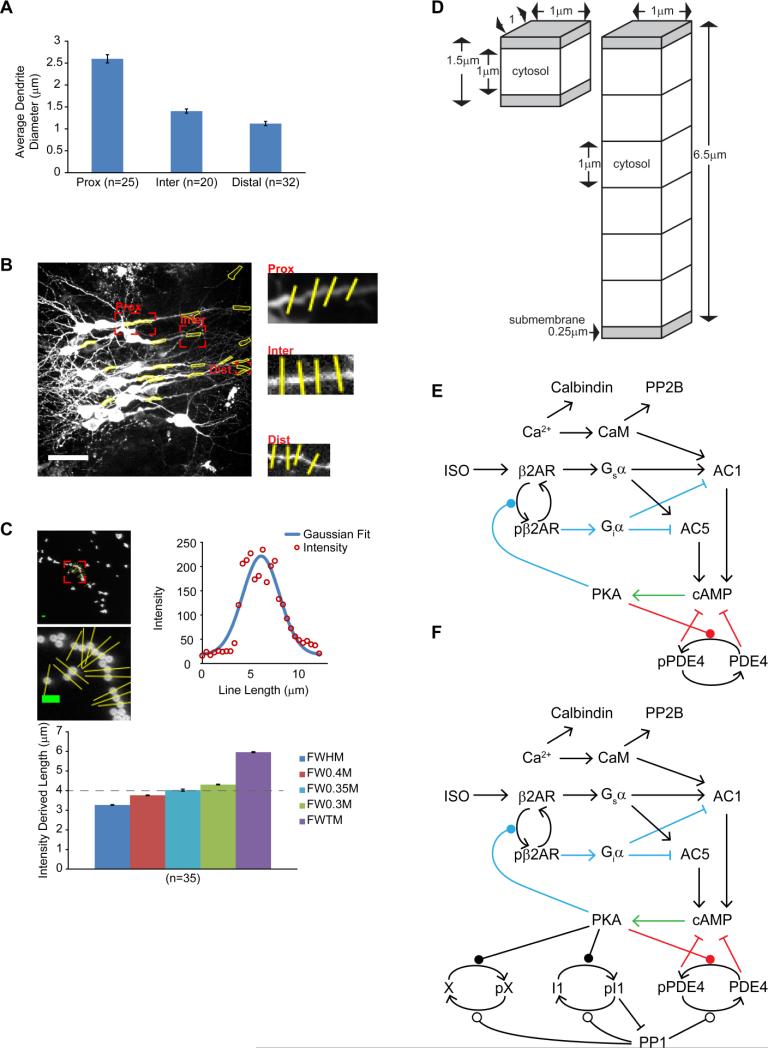
Figure 3. Spatial compartmental model of CA1 neuronal compartments.
(A) Compartment diameter of proximal dendrites (2.6 ± 0.1 μm), intermediate dendrites (1.4 ± 0.1 μm) and distal dendrites (1.1 ± 0.1 μm) on CA1 neurons. Values are mean ± standard error of dendrites measured from three slices. (B) Four line scans were taken across the same regions used for measuring cAMP transients to calculate the average diameter at that region. White scale bar is 40 μm. (C) Line scans intensity plots were calibrated to 4 μm fluorescent beads and the full-width of the intensity plot was calculated at 35% of the max was used to for dendrite measurements. Other measures along the intensity plot are full-width half-max (FWHM), 40% max (FW0.4M), 35% (FW0.35M), 30% (FW0.3M) and full-width tenth max (FWTM). Green scale bar is 8 μm. (D) Compartment dimensions used in computational simulations. (E-F) Major components of the signaling pathway used to simulate cAMP transients and PKA activity without (E), and with (F) the addition of protein phosphatases and molecule X. Feedback loop 1 is in blue, feedback loop 2 is in red and the green arrow is common to both pathways.

