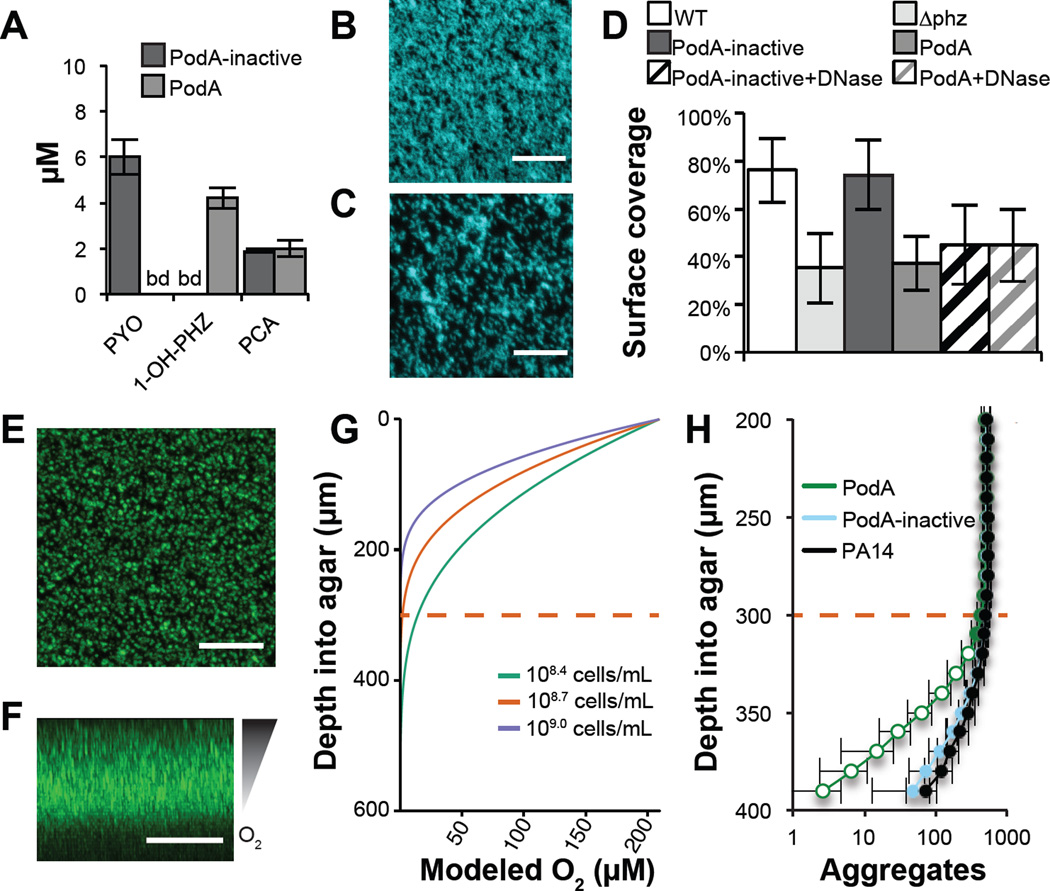
Figure 4. PodA30–162 inhibits biofilm formation and anoxic fitness of P. aeruginosa.
(A) Phenazines were measured by HPLC in biofilm supernatants after 5 hours of growth. PCA, phenazine-1-carboxylic acid. (B) P. aeruginosa forms a robust biofilm in the presence of inactivated PodA30–162 after 5 hours. (C) In the presence of PodA30–162, biofilm surface coverage was decreased. Surface coverage was 43.5 percent compared with 82.7 percent in the absence of PodA30–162 in the representative images shown. Scale Bars = 20 µm. (D) Surface coverage was lower in the presence of PodA30–162 (p < 10−6 vs. PodA-inactive, two-tailed Student’s t-test). DNase addition decreased surface coverage (p < 10−3 vs. PodA-inactive), but DNase and PodA30−162 combined did not have an additive effect (p > 0.05), consistent with an interaction between PYO and eDNA in supporting biofilms (22). Data are averages of 12 replicates taken from independent cultures. Error bars represent one standard deviation around the mean. ∆phz, PA14 mutant incapable of making phenazines. (E) Top down and (F) side views of P. aeruginosa grown embedded in 0.5% agar blocks for 27 hours. Scale bars = 200 µm. Oxygen depletion occurs at lower depths as a result of biological consumption outpacing diffusion from the surface, resulting in decreased biomass. (G) Oxygen diffusion model predicting the shape of the oxycline in agar blocks. Cell densities were estimated at 108.7 cells mL−1 based on aggregate number and volume. Modeling this concentration and 2-fold higher and lower densities suggests that oxygen depletion occurs ~300 µm ± 100 µm below the agar surface. Dashed red line indicates the approximate oxic-anoxic interface. (H) Biofilm aggregates detected at 10 µm increments below the agar surface. At depths near the oxic/anoxic interface (dashed red line), total biomass begins to decline. In assays treated for the last 5 hours with PodA30−162, there is an apparent biomass defect specifically at anoxic depths compared to untreated and inactive PodA treated controls, consistent with the importance of PYO for anoxic survival in P. aeruginosa. Data are averages of six independent experiments and error bars represent one standard deviation around the mean. Open symbols, p < 0.01, two-tailed Student’s t-test.

