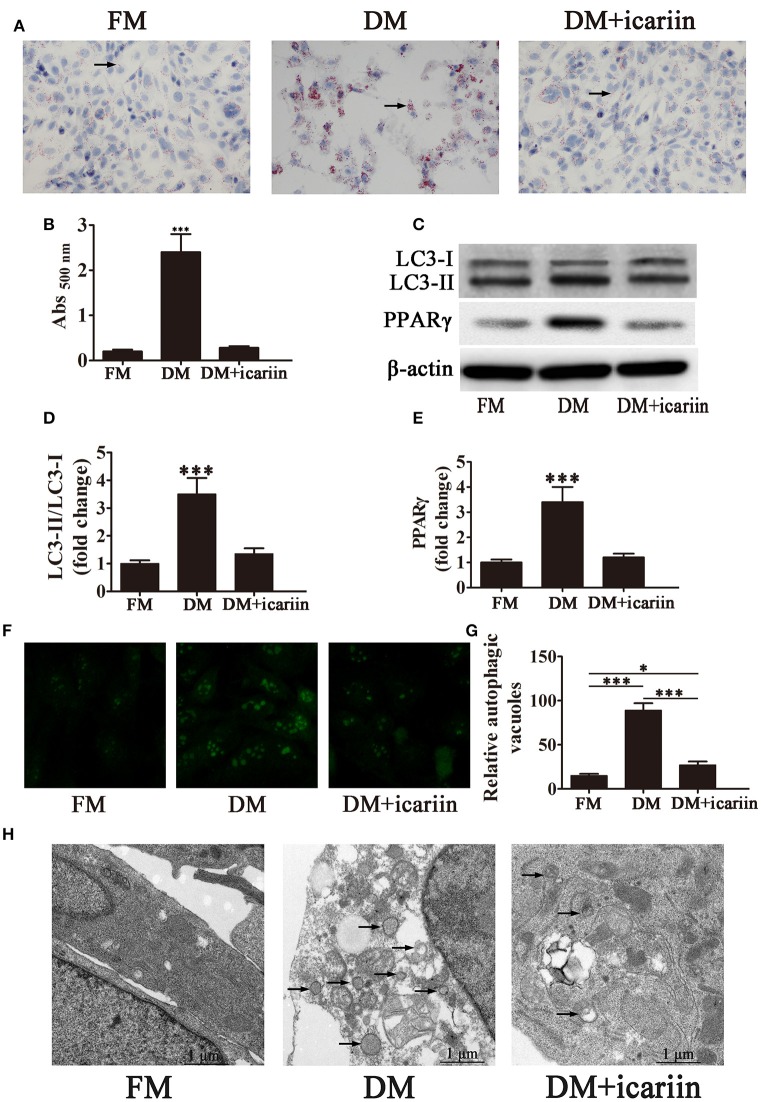
Figure 2.
Icariin treatment inhibits adipogenesis of 3T3-L1 cells by suppressing autophagy. 3T3-L1 preadipocytes were incubated in adipocyte DM in the presence or absence of 5 μM icariin. (A) Oil Red O staining showing the effect of icariin on lipid droplet accumulation. (B) Quantification of intracellular lipids of 3T3-L1 cells by spectrophotometry. Data represent the mean ± SD. ***P < 0.001 vs. the untreated control (n = 5). (C) Western blot analysis the expression of the autophagy markers LC3-I, LC3-II, and PPARγ with β-actin as the loading control. (D,E) The LC3-II/LC3-I ratio and relative PPARγ expression were quantified by densitometric scanning and graphed. Data indicate the mean ± SD (n = 5). ***p < 0.001 vs. FM. (F) Representative fluorescence microscopy images of GFP-LC3 transfected cells treated as indicated (magnification: 400×). (G) The number of autophagosomes was counted in 10 random fields. The data represent the mean ± SD. (n = 10), *P < 0.05, ***P < 0.001. (H) Electron microscopy images (5000×) show the inhibition of autophagy in response to icariin treatment. Arrows, autophagic vacuoles. FM, control medium; DM, differentiation medium.

