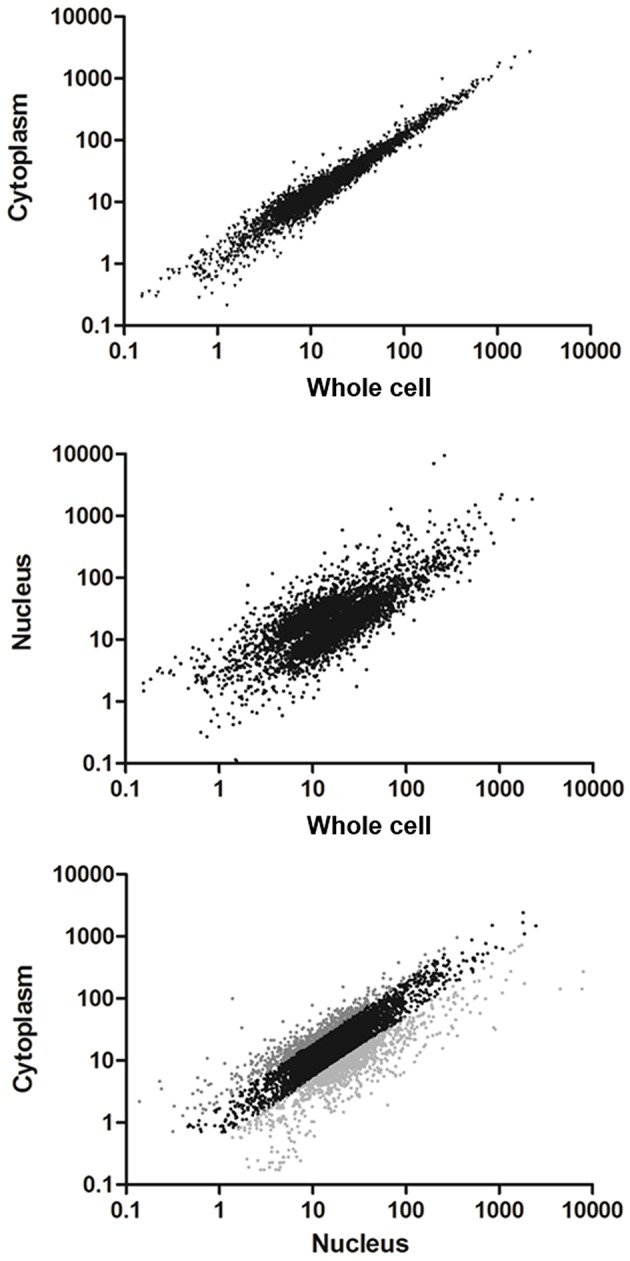
Figure 3.

Comparison of transcriptomes derived from whole cell to the subcellular fractionation of nucleus and cytoplasm in T. cruzi epimastigotes. Scatter plot of the estimated expression levels as reads per kilobase of transcript per million mapped reads (RPKM) for genes with >10 reads in the transcriptomes. Upper panel: transcriptome derived from cytoplasm fraction vs. whole cell (Pearson correlation coefficient r = 0.98). Middle panel: transcriptome derived from nucleus fraction vs. whole cell (Pearson correlation coefficient r = 0.43). Bottom panel: transcriptome derived from cytoplasm vs. nucleus fractions (Pearson correlation coefficient r = 0.53). Differentially expressed genes (FC ≥ 2, p < 0.01) are shown in light gray for those whose transcript levels in cytoplasm were higher than in nucleus and dark gray for those whose transcript levels in nucleus were higher than in cytoplasm.
