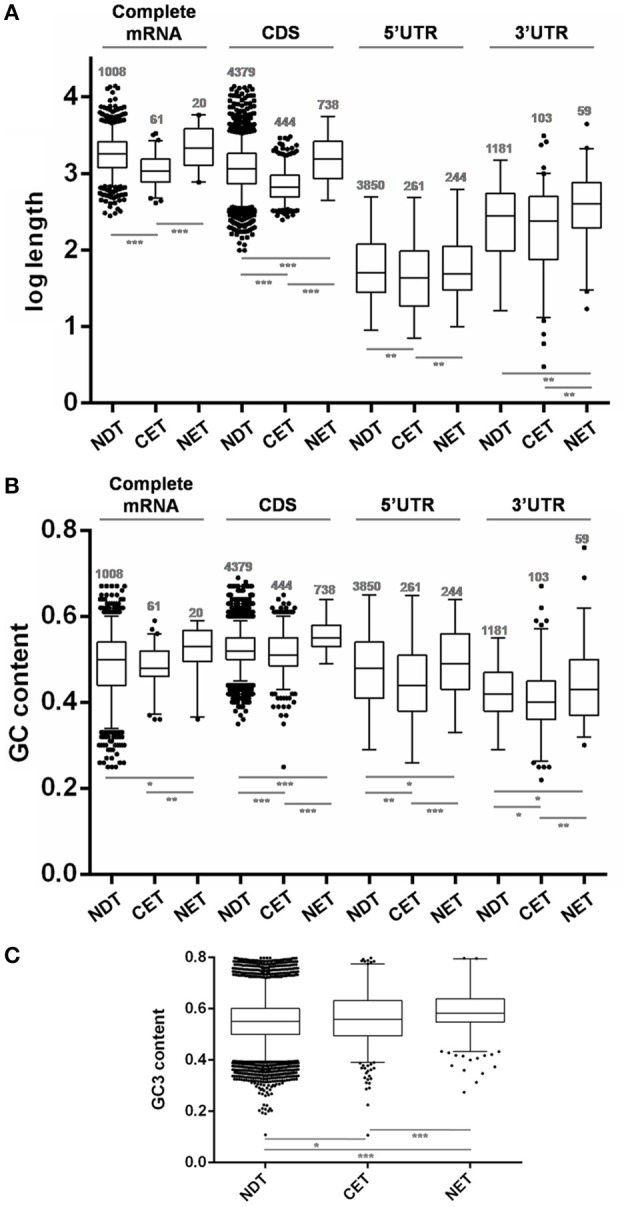
Figure 5.

Length and GC content of transcripts differentially distributed between nucleus and cytoplasm fractions of T. cruzi epimastigotes. (A) Box plots of transcript gene length in nucleotides (nt). (B) GC content depicted as %. (C) GC3 content depicted as %. The analyses were done for the cytoplasmic enriched transcript (CET), nuclear enriched transcript (NET) and not differentially distributed transcript (NDT). The corresponding CDS, the 5′ UTR, the 3′ UTR and the complete mRNA (when both 5′ and 3′ UTR of a gene could be determined) are presented (*p < 0.01, **p < 0.005, ***p < 0.0001).
