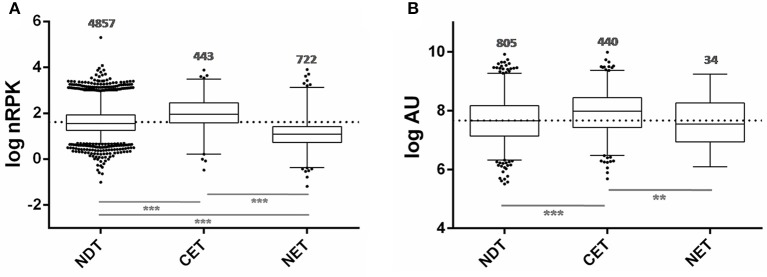
Figure 6.
Ribosome occupancy and Protein abundance of transcripts differentially distributed between nucleus and cytoplasm of T. cruzi epimastigotes. (A) Box plots of ribosomal footprints from Smircich et al. (2015) as normalized reads per kilobase (nRPK) for genes with cytoplasmic enriched transcript abundance (CET), with nuclear enriched transcript abundance (NET) and with not differentially distributed transcript abundance (NDT). (B) Box plots of protein abundance for the indicated set of genes obtained from de Godoy et al. (2012) expressed in arbitrary units (AU) (**p < 0.005, ***p < 0.0001).

