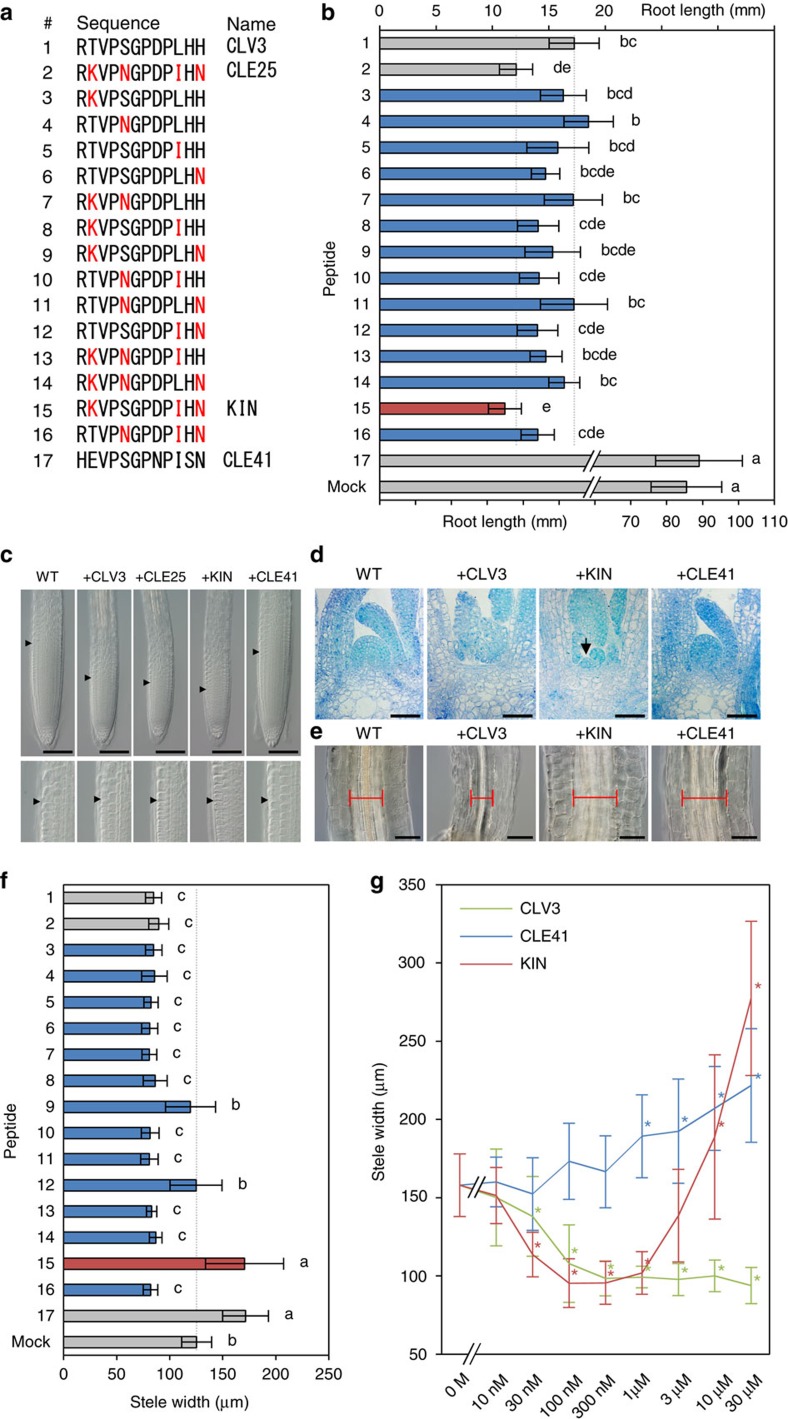
Figure 1. Identification of a bifunctional CLE peptide.
(a) Sequence alignment of CLE peptides. CLV3 (1), CLE25 (2) and CLE41 (17) are endogenously encoded sequences, whereas the others, including KIN (15), are intermediate sequences between CLV3 and CLE25. Residues changed from CLV3 to CLE25 are coloured red. (b) Effects of 1 μM peptides on 14-day-old root length. The upper scale is for treatment 1–16 and the lower scale is for treatment 17 and mock. The grey dashed lines indicate the levels for CLV3/CLE25 peptide treatment. (c) Effects of 1 μM peptides on 4-day-old RAM morphology. The arrowheads indicate the RAM areas. Lower panels show magnification of the boundary areas. (d) Effects of 10 μM peptides on 10-day-old SAM morphology. An arrowhead indicates a residual SAM. (e) Effects of 10 μM peptides on stele morphology in 10-day-old hypocotyls. Red bars indicate the stele width. (f) Effects of 10 μM peptides on 10-day-old hypocotyl stele width. (g) Dose–response relationships in 10-day-old stele width. Photos in c–e are representatives among three or more biologically independent samples. Data in b,f and g represent mean values±s.d. (n=13–20 in b, 13–16 in f, 12–16 in g, see Supplementary Data 1 for individual sample sizes). In b,f, means sharing the superscripts are not significantly different from each other in Tukey's HSD test, P<0.05. Asterisks in g indicate a significant difference from mock treatment (0 M) in two-tailed Welch's t-test, P<0.05. Scale bars, 100 μm (c,e) and 50 μm (d).

