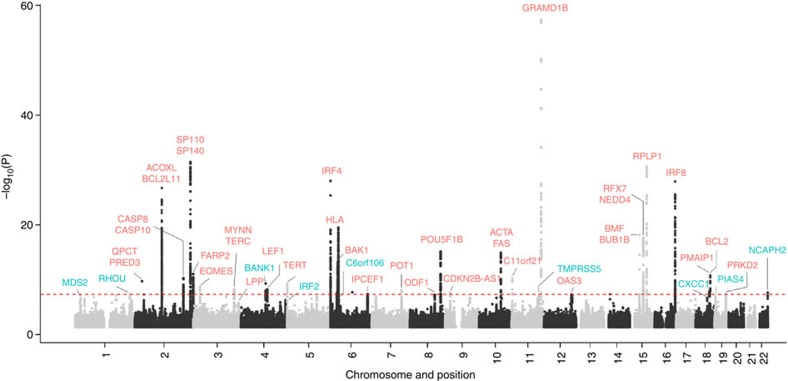
Figure 1. Manhattan plot of association P values.
Shown are the genome-wide P values (two-sided) of >10 million successfully imputed autosomal SNPs in 4,478 cases and 13,213 controls from the discovery phase. Text labelled in red are previously identified risk loci, and text labelled in blue are newly identified risk loci. The red horizontal line represents the genome-wide significance threshold of P=5.0 × 10⁻⁸.

