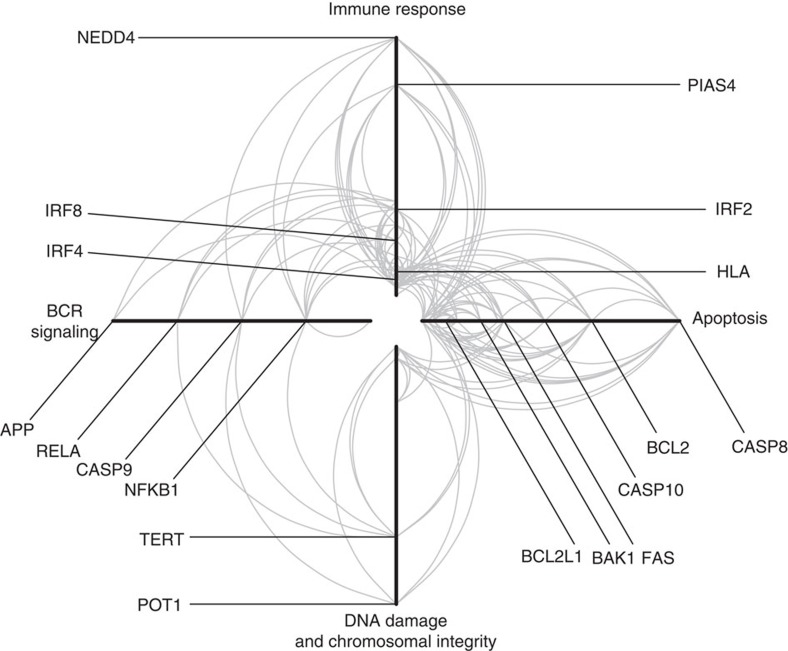
Figure 5. Hive Plot of common protein–protein interactions in CLL.
Each arm represents a functional annotation term, each arc represents an interaction between two proteins and the distance from the centre of the plot corresponds to a greater number of protein–protein interactions (higher degree of the node). The left arm represents proteins annotated as being involved in BCR signalling; the top arm represents proteins annotated as immune response; the right arm represents proteins involved in apoptosis; and the bottom arm represents proteins involved in DNA damage and chromosomal integrity. Selected proteins known to be involved in CLL risk are shown.

