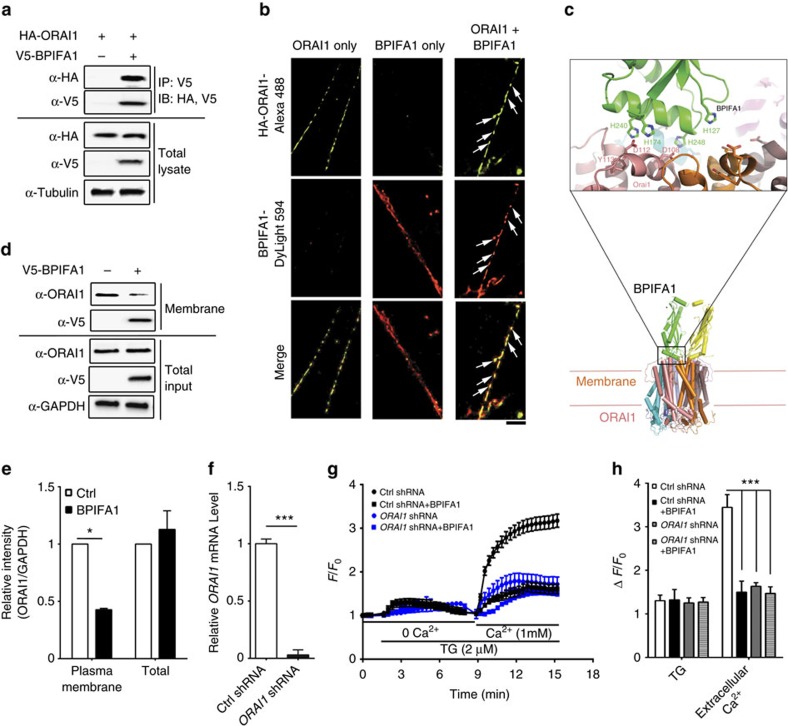
Figure 4. BPIFA1 modulates SOCE by interacting with Orai1.
(a) Immunoprecipitation analysis was performed using cell lysates from HEK293T cells cotransfected with V5- BPIFA1 and HA-Orai1. HA-Orai1 was pulled down by V5-BPIFA1. Data represent three independent immunoprecipitations. (b) Ground-state depletion super-resolution images of HA-tagged Orai1 (Green) and DyLight 594 labelled BPIFA1 (Red) in ASMCs. Scale bar is 2.5 μm. (c) BPIFA1–ORAI1 complex model: a model of human Orai1 was created using the structure of Drosophila Orai1 as a guide (RCSB 4HKR), and the structure of human BPIFA1 (RCSB 4KGH) was manually docked onto the Orai1 hexamer by aligning conserved electrostatic features. (d) Human ASMCs were incubated with 10 μM BPIFA1 for 4 h, followed by surface biotinylation and immunoblot using indicated antibodies. (e) Mean densitometry of plasma membrane and total Orai1/GAPDH and expressed as relative intensity (n=3). (f) Human ASMCs were transfected with control and ORAI1 shRNA respectively. mRNA levels of Orai1 were measured by qRT–PCR. (g) Average traces of Ca2+ imaging using fura-2. Human ASMCs were transfected with control and ORAI1 shRNA respectively, for 72 h. After incubating with or without 10 μM BPIFA1 for 1 h, fura-2 emission ratio was then recorded over time. (h) Summary of peak fluorescent ratio change in the presence of TG (n=3 per group). Data in e–h are mean±s.e.m. The data were analysed using Mann-Whitney in e and f, one-way ANOVA followed by Tukey post hoc analysis in h. *P<0.05, ***P<0.001 different to control.

