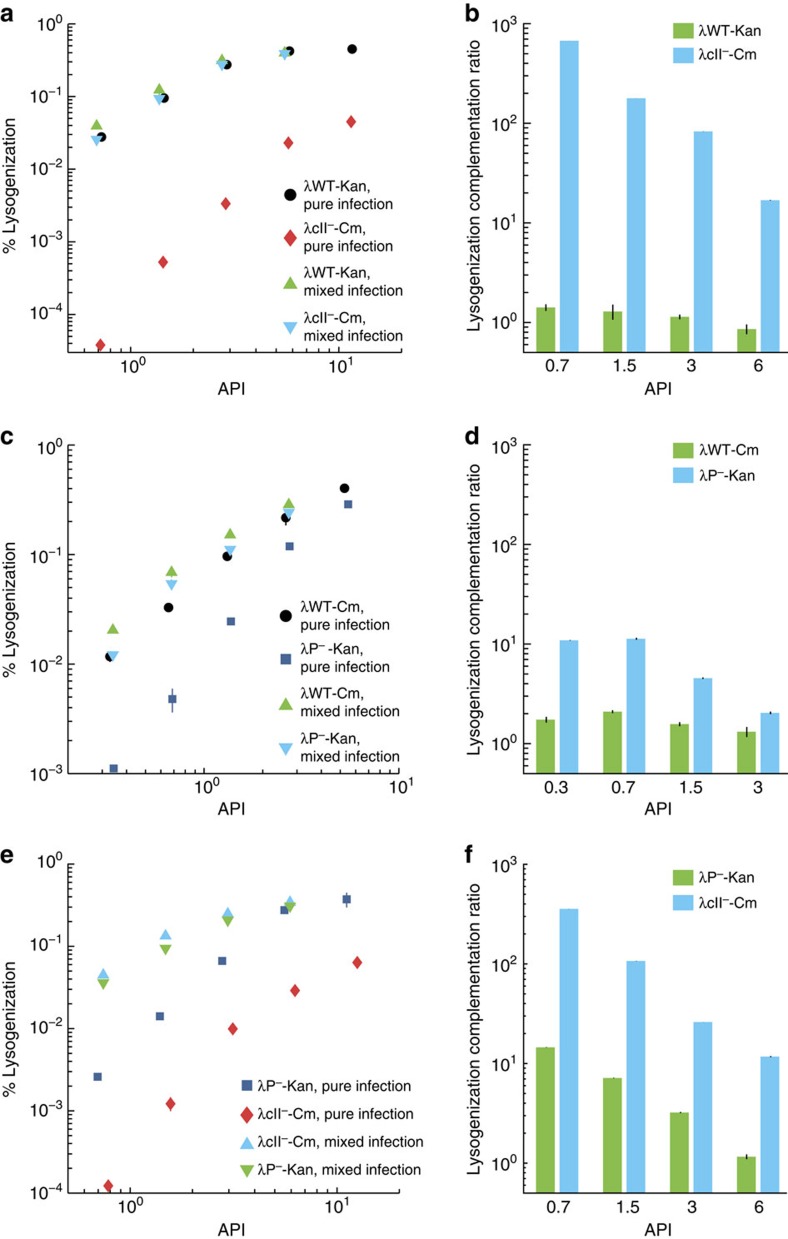
Figure 4. Phages cooperate during lysogeny to mutually propagate integration.
(a,c,e) Mixed bulk lysogenization using WT phage mixed in a 1:1 ratio with either mutants λcII− (a) or λP− (c), and 1:1 ratio mixture of λcII− and λP− show complementation of mutant lysogenization defects via co-infection. Lysogenization frequency of pure infections with WT (circles), λcII− (diamonds), and λP− (squares) versus API are plotted on a log-log scale. Total phage integrations from mixed infections including lysogens from pure phage integrations and mixed phage integrations are shown (a,c, mutants in down triangles, and WT in up triangles, and e, up and down triangles correspond to different mutants) for each API, referring specifically to the number of mutant or WT phages. (b,d,f) Quantification of change in lysogenization from pure infections to mixed infections. (b corresponds to a,d to c and f to e). Values are calculated for each API by dividing the % lysogenization in the mixed infection by the % lysogenization in the pure infection; the bar represents the fold change in integration frequency, where ‘1' is no change. WT shows generally positive changes, and the mutants show increased lysogen frequency substantially. Representative plots are shown for each experiment, which were done with at least two biological replicates consisting of two technical replicates each. Error bars represent±s.d. of the technical replicates.

