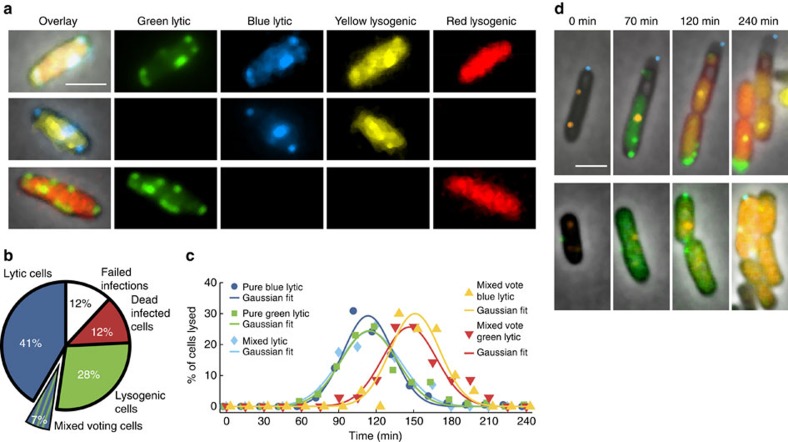
Figure 6. Mixed voting for fates occurs between phage DNAs in a cell and delays lytic development.
(a) Examples of three different mixed voting cells including overlay images and their component fluorescence channels. The top row shows a ‘cross-phage mixed voting' cell with green and blue lytic signals and with red and yellow lysogenic signals. The middle and bottom rows show examples of ‘same-phage type mixed voting', as both lytic and lysogenic reporters can be found on the same phage. (b) A pie chart is shown comparing the different fates of all cells in this study (1,006 infected cells). Seven per cent are mixed voting cells resulting in lysis. (c) Lytic cells were divided into different groups: pure blue (N=178) (circles), pure green (N=179) (squares), mixed lytic (N=57) (diamonds), mixed voting blue lytic (N=35) (up triangles) and mixed voting green lytic (N=20) (down triangles). The number of cells lysed since the previous time point, as a percentage of the total group, is plotted with time. Each group's distribution is well fitted to a Gaussian distribution (lines), with an average lysis time of 114 min (pure blue), 114 min (pure green), 115 min (mixed lytic), 147 min (mixed voting blue) and 151 min (mixed voting green). (d) Example cells show lytic development yet lysogenic development and cell division using phage DNA reporter cells and fully/unmethylated phages. In the top and bottom rows the green and blue phages are methylated, respectively, with orange foci representing the ejected/replicated DNA. Green lytic signal builds up, but with time, the lysogenic reporter expression occurs (red or orange, the DNA reporter shares the same fluorescent protein as one lysogenic reporter) and the cell divides multiple times during the course of the movie, while the lytic signal ceases to accumulate. Scale bars, 2 μm.

