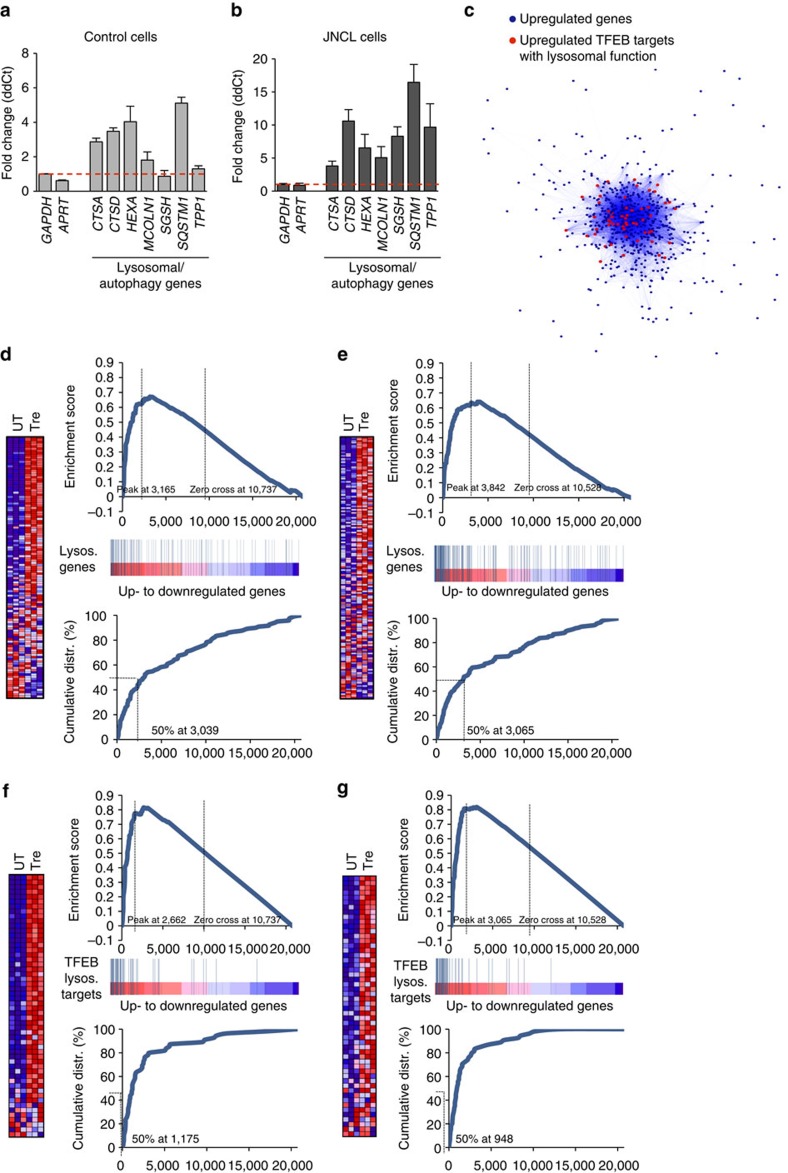
Figure 5. Activation of the CLEAR network by trehalose.
(a,b) Expression analysis of control (CTRL; a) and JNCL fibroblasts (b) showing upregulation of lysosomal genes on trehalose treatment. Gene expression was normalized relative to the housekeeping gene, GAPDH. (c) Cytoscape-generated network representing genes upregulated by trehalose administration. Dots (representing genes) are connected by blue lines with colour intensity proportional to the extent of co-regulation. The network has a core of genes with tighter expression relationships containing TFEB lysosomal targets (center of network), while other genes more loosely correlated are found in the periphery of the network. (d,e) GSEA of transcriptome changes following trehalose administration to CTRL (d) and JNCL fibroblasts (e), with lysosomal genes. Upper panels show the enrichment plots generated by GSEA of ranked gene expression data (left, red: upregulated; right, blue: downregulated). Vertical blue bars indicate the position of genes in each selected gene set within the ranked lists. Lower panels show the cumulative distribution of lysosomal genes within the ranked lists. The ranking positions that include 50% of analysed genes are indicated. The analysis shows enrichment of lysosomal genes among genes that were upregulated following trehalose administration. (f,g) GSEA of transcriptome changes following trehalose administration to CTRL (f) and JNCL fibroblasts (g), with lysosomal genes and TFEB targets with a known role in lysosomal metabolism being reported. TFEB lysosomal targets have a higher ES score than general lysosomal genes, indicating that trehalose preferentially upregulated TFEB targets participating in lysosomal function in both control and JNCL fibroblasts. Data represent means±s.e.m.

