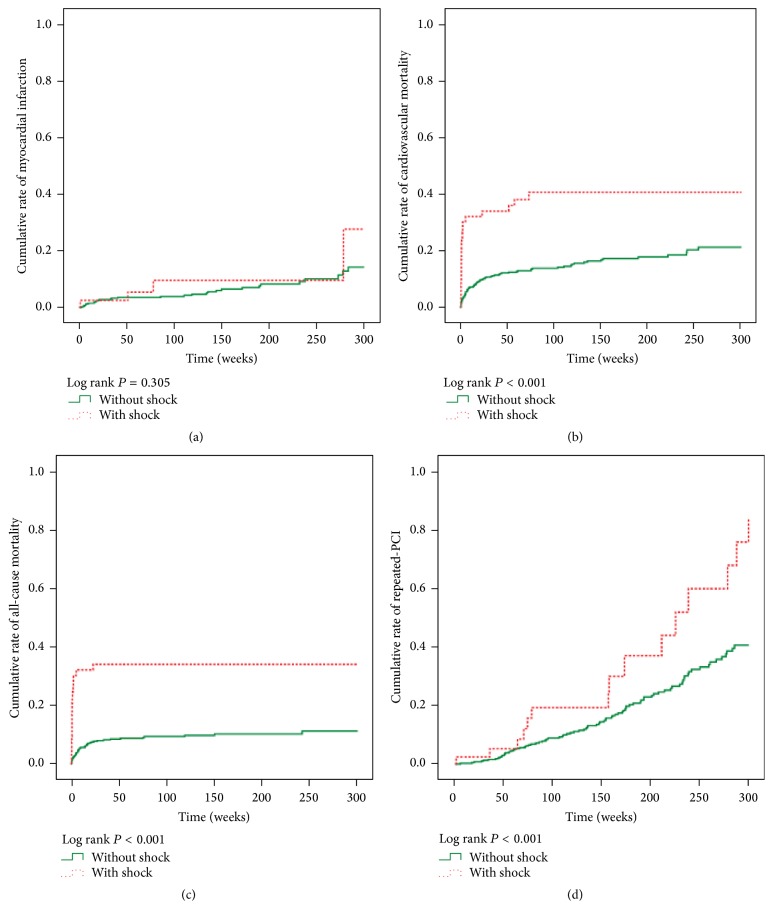
Figure 1.
(a) Cumulative rate of myocardial infarction between the two groups (P = 0.305). (b) Cumulative rate of cardiovascular mortality between the two groups (P < 0.001). (c) Cumulative rate of all-cause mortality between the two groups (P < 0.001). (d) Cumulative rate of repeated-PCI between the two groups (P = 0.001).

