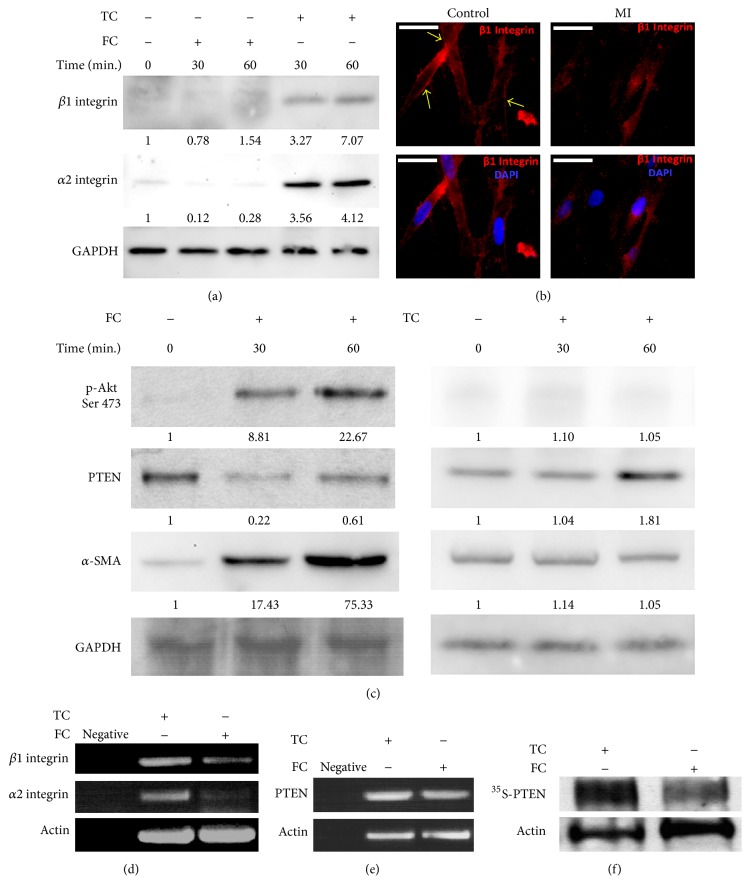
Figure 2.
Low expression of α2β1 integrin and PTEN was respond to FC. (a) Western blots showed that both α2 and β1 integrin were expressed on TC or FC. (b) β1 integrin expression was in fibroblasts of control or the lesion of MI in mice by immunofluorescence. Bar = 50 microns. (c) The expression levels of p-AKT, AKT, PTEN, and α-SMA on FC by Western blot on FC and TC. ((d) and (e)) The total RNA of α2 and β1 integrin, actin, and PTEN was analyzed by semiquantitative RT-PCR. (f) PTEN stability was measured by Pulse-Chase assay on TC or FC. The number is the ratio of indicated protein/GAPDH or AKT according to densitometry assay.

