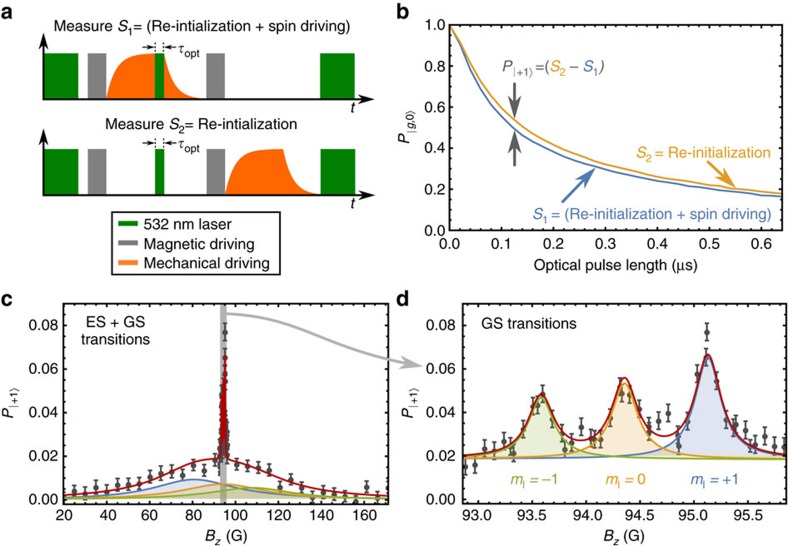
Figure 2. Spin–strain spectroscopy.
(a) Pulse sequences used to measure excited state (ES) spin driving. (b) Population in  at the end of the pulse sequences in a plotted against
  . (c) Spectrum of the spin population driven mechanically into
 by the ES and ground state (GS) spin–strain interactions. The red curve is a least squares fit to the sum of six Lorentzians. (d) Zoomed in view of the GS spin transitions in c. The data in c,d were measured on one device with an NV centre ensemble, and error bars are from the s.d. in photon counting.

