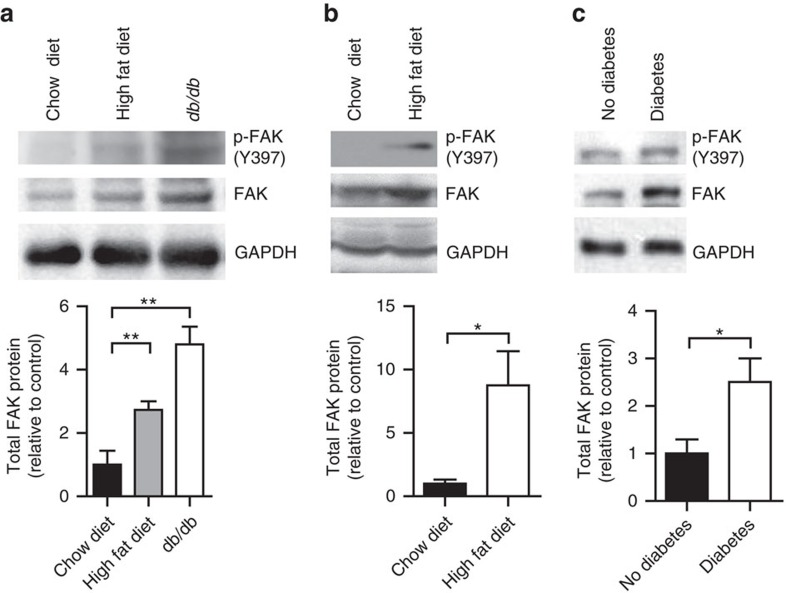
Figure 1. FAK increases in adipose tissue with obesity and insulin resistance.
(a,b) Representative blot and quantification of FAK protein in adipocytes isolated from perigonadal WAT (n=4 mice) (a) and interscapular BAT (n=5 mice) (b) of 20-week-old mice fed HFD or db/db mice relative to chow diet-fed mice. (c) Representative blot and quantification of FAK in protein lysates from omental adipocytes of humans with and without type 2 diabetes (DM) (n=3 humans). Data are mean±s.e.m. *P<0.05 and **P<0.01 by Student's t-test.

