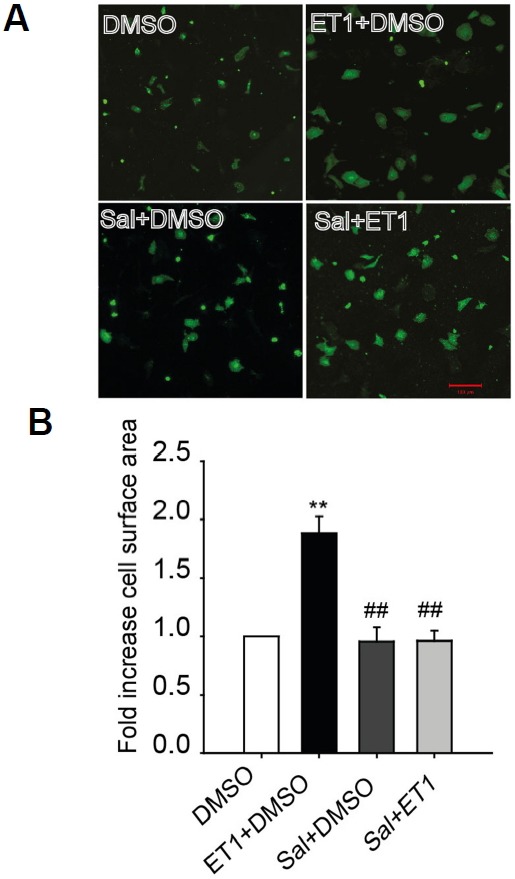
Fig. 2. Salubrinal (Sal) reduced cardiomyocyte hypertrophy.

(A) Immunofluorescence imaging showing cell sizes of NRVMs treated with 100 nM endothelin1 (ET1) in the presence or absence of 75 μM salubrinal (scale bar, 100 μm). (B) Fold increase in cell surface area compared to dimethyl sulfoxide (DMSO) control. All data represent mean ± SEM; *P < 0.05, **P < 0.01 vs. DMSO control and #P < 0.05, ##P < 0.01 vs. ET1. (n = 100 cells for each group)
