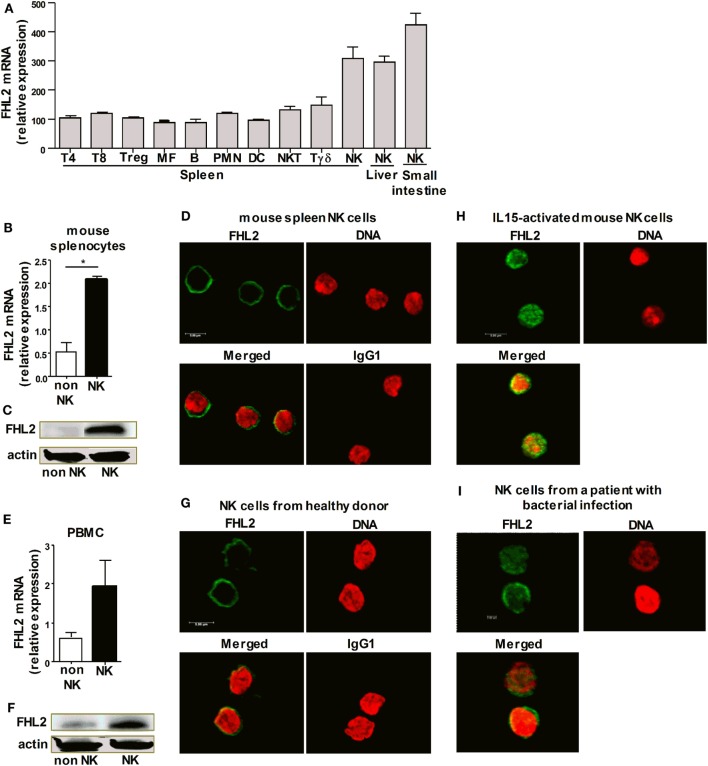
Figure 1.
FHL2 expression in human and mouse natural killer (NK) cells. (A) Genome-wide expression analysis was performed on mouse cells using raw microarray data generated by the Immgen Consortium. The list of all Gene Expression Omnibus accession numbers and corresponding cell populations and series is available in Table S1 in Supplementary Material. (B–D,H) NK cells were purified from wild-type mouse spleens. (E–G) NK cells were purified from the peripheral blood of healthy donors. (B,E) FHL2 mRNA was analyzed using RT quantitative PCR and normalized to GAPDH mRNA in purified NK cells and in non-NK cells. The data are shown as the means ± SEM of at least three independent experiments. *p < 0.05 using the Mann–Whitney test. (C,F) Western blot analysis of NK cell lysates. Data are representative of three experiments. (H) NK cells were stimulated for 30 min with rmIL-15. (I) NK cells were purified from the peripheral blood of patients with a severe bacterial Community-Acquired Pneumonia. (D,G–I) FHL2 protein expression was assessed by immunofluorescence using an anti-FHL2 antibody, and DRAQ5™ was used to detect dsDNA. These panels show representative staining of at least two independent experiments.

