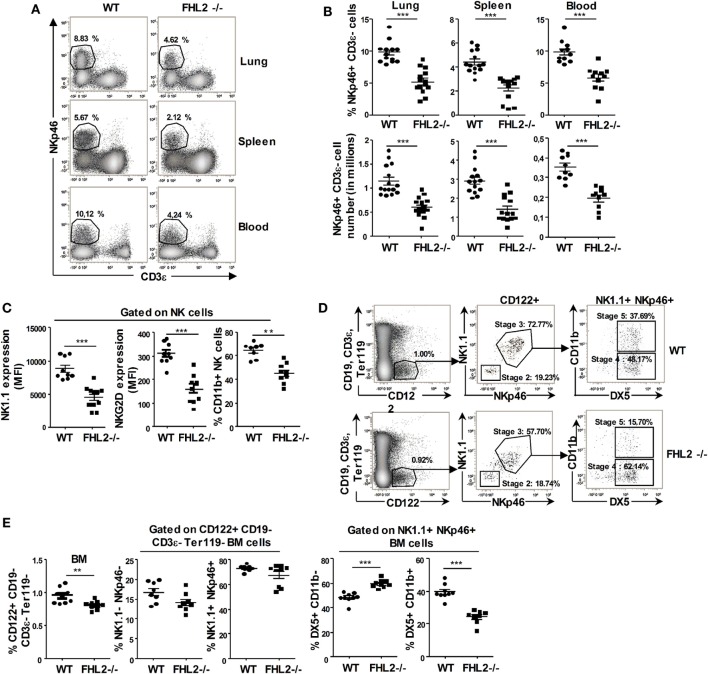
Figure 2.
Natural killer (NK) cell development in FHL2−/− mice. Flow cytometric analysis of NK cells in various organs of FHL2−/− and wild-type mice. (A,B) NK cells were defined as CD19− CD3ϵ− NKp46+ cells. (A) One representative experiment of the gating in different organs is shown. The percentage of NK cells in each organ is indicated. (B) Dots corresponding to the NK cell number and percentage for the indicated organs ± SEM of three experiments (n = at least 10 mice) are shown. (C) Flow cytometric analysis of NK1.1 and NKG2D expression and the CD11b+ percentage within CD19− CD3ϵ− NKp46+-gated spleen NK cells ± SEM of two distinct experiments are shown. (D) Gating strategy to identify the different stages of NK cell development in the bone marrow (BM). The percentages of cells in each of the specified gates are indicated. (E) Dots corresponding to the NK cell frequency for the indicated stage of development in the BM ± SEM of two distinct experiments are shown. (B,C,E) Each dot represents the data from one mouse. (B,C,E) *p < 0.05, **p < 0.01, ***p < 0.001 by Mann–Whitney test. (A–C) Data were confirmed using FHL2+/+ littermate mice.

