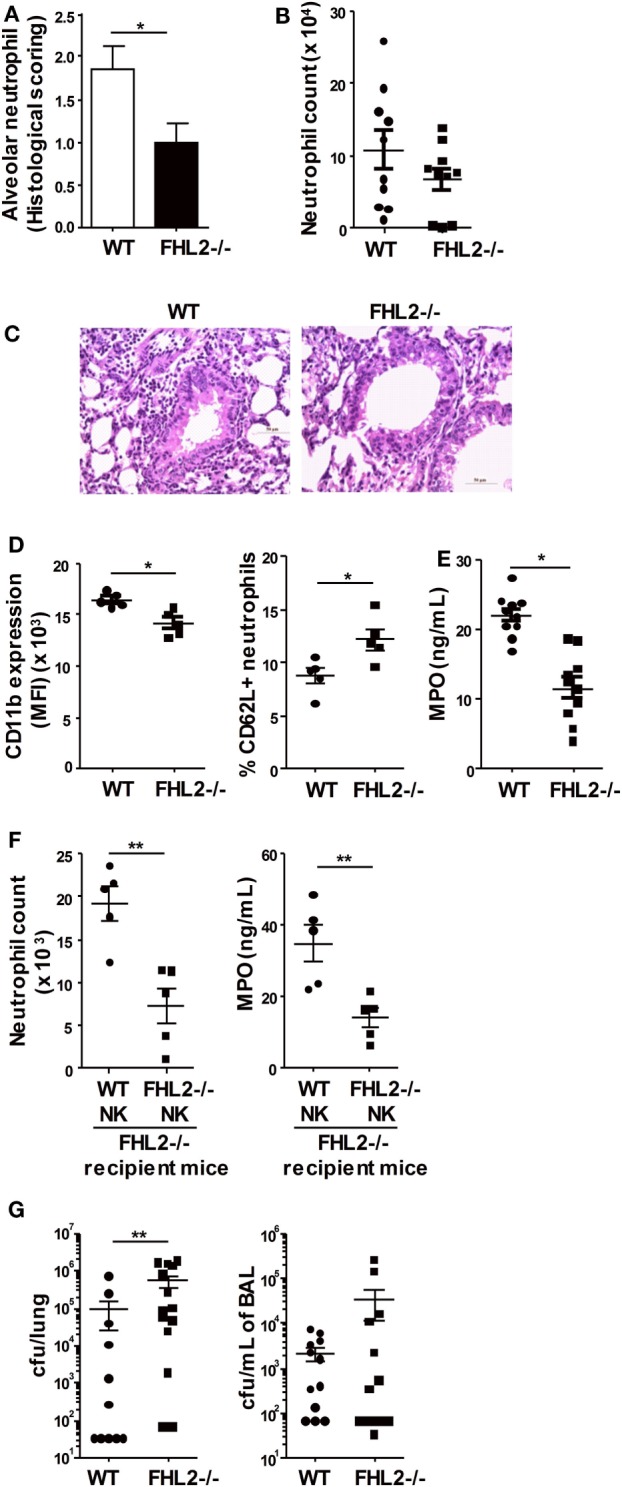
Figure 5.

Impaired antibacterial immune response in FHL2-deficient mice. Mice were infected i.n. with 5 × 10⁵ cfu (LD50) S. pneumoniae. (A,C) Histological examination of the lung tissue obtained from wild-type (WT) and FHL2−/− mice 24 h postinfection, stained with hematoxylin-eosin and examined by light microscopy. (A) Semi-quantitative pathology scores (described in experimental procedures) for the neutrophil number per lung microscopic field. The data are presented as the means ± SEM of two distinct experiments (n = 5 mice per group) are shown. *p < 0.05 by Mann–Whitney test. (B) Neutrophil numbers were determined by flow cytometry in the bronchoalveolar lavage (BAL) obtained from WT and FHL2−/− mice 24 h postinfection. (C) Representative photomicrographs of lung sections to show neutrophil colonization of WT and FHL2−/− lungs. (D) Flow cytometric analysis of CD11b expression and CD62L+ percentage on F4/80− Ly6Ghigh-gated neutrophils in the BAL obtained from WT and FHL2−/− mice 24 h postinfection. Data are representative of three distinct experiments. (E) The protein expression of myeloperoxidase (MPO) was determined by ELISA in the BAL obtained from WT and FHL2−/− mice 48 h postinfection. The mean ± SEM of two experiments is shown. (F) Purified natural killer cells from FHL2−/− mice or WT mice were i.v. injected in FHL2−/− recipient mice at the time of infection. Then, neutrophil numbers and MPO expression were determined by flow cytometry and ELISA, respectively, in the BAL 24 h postinfection (n = 5). (G) Bacterial burden in the lungs and BAL obtained from WT and FHL2−/− mice 48 h postinfection. Data are representative of two distinct experiments. (B,D–G) Each dot represents the data from one mouse. *p < 0.05, **p < 0.01 by Mann–Whitney test.
