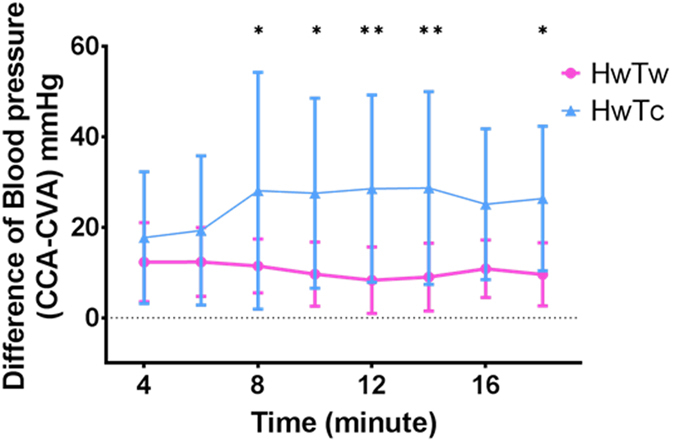
Figure 3. The systolic blood pressure difference was increased by cooling the tail of the rat.

The graph shows the change over time under each condition. A significant blood pressure disparity was observed in the tail cooling group (HwTc) compared to the control group (HwTw). *(0.01 < P < 0.05) and **(P < 0.01) based on two-way ANOVA.
