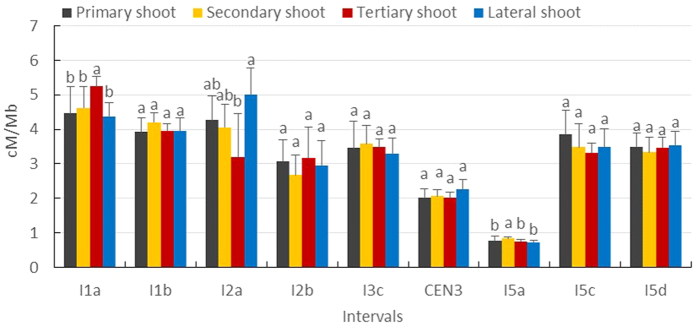
Figure 4. Mean recombination frequency during the entire development of each shoot type in nine different genomic intervals.
Statistical significance was analyzed based on one-way ANOVA [I1a (F = 12.8200, p = 0.0020), I1b (F = 1.9040, p = 0.2074), I2a (F = 5.5220, p = 0.0238), I2b (F = 0.4580, p = 0.7193), I3c (F = 1.2450, p = 0.3561), CEN3 (F = 1.3560, p = 0.3236), I5a (F = 17.6830, p = 0.0007), I5c (F = 0.9230, p = 0.4725) and I5d (F = 0.7060, p = 0.5746), p value was calculated with post-hoc Tukey HSD test (α = 0.05)].

