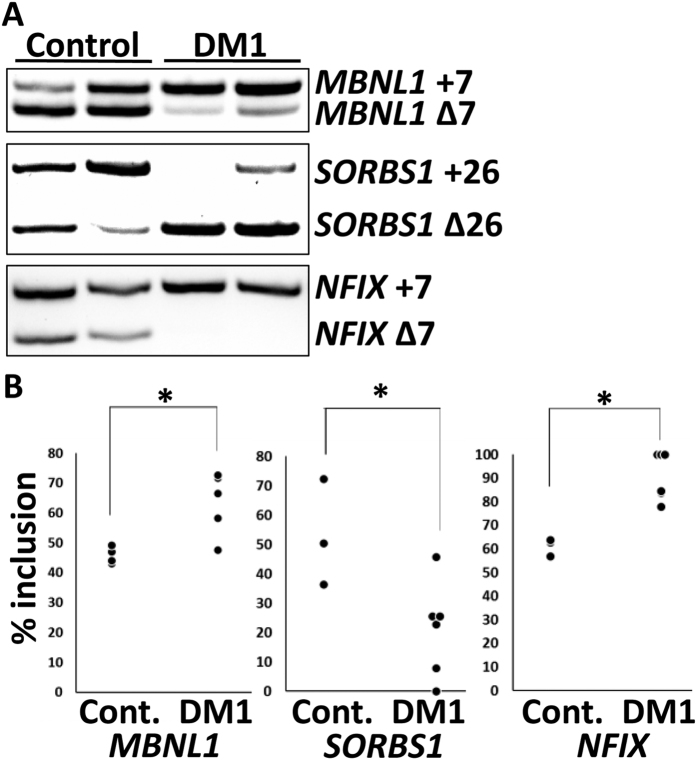
Figure 2. Splicing defects in differentiated cells from control iPSCs and DM1-iPSCs.
(A) Representative reverse transcription polymerase chain reaction (RT-PCR) results of control CMs (Control, n = 2) and DM1-CMs (DM1, n = 2). The measured exons are indicated on the right. (B) Exon inclusion values. The Y-axis indicates the percentage of exon-including bands versus the number of exon-including and -skipping bands. Cont. = control cells. Student’s t-test was used to compare the control and DM1 groups (*P < 0.05). MBNL1: Cont. CMs, n = 4, DM1 CMs, n = 6; 10 RT-PCR products were loaded on the gel at the same time. SORBS1: Cont. neurons, n = 3, DM1 neurons, n = 6; 9 RT-PCR products were loaded on the gel at the same time. NFIX: Cont. myocytes, n = 3, DM1 myocytes, n = 6; 9 RT-PCR products were loaded on the gel at the same time.

