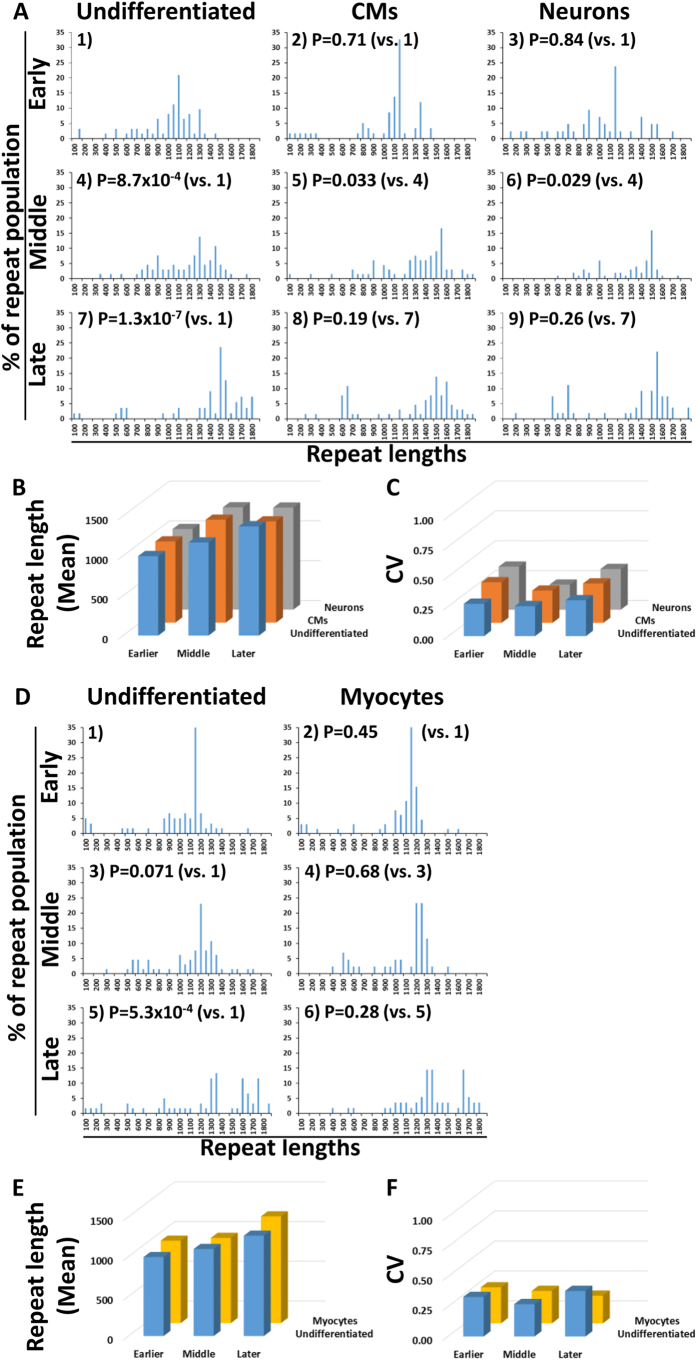
Figure 3. CTG repeats of Pt-1B.
(A) The distribution of the CTG repeats in the undifferentiated iPSCs and the CMs and neurons differentiated from the undifferentiated iPSCs at early (passages 10–17), middle (passages 21–27) and late passage numbers (passages 31–37), following the strategy shown in Fig. 1A, left. The lengths of the CTG repeats were grouped in bins spanning 50 repeats. Student’s t-test was applied to each group of different CTG repeat lengths before being grouped in bins. P-values are shown. Because of the multiple comparison, the appropriate significance level was determined by Bonferroni correction, requiring a P ≤ 0.0056 to be significant at the 95% level. P stands for P-values. (B) Mean repeat length of the nine samples. The original lengths before being grouped in bins were used to calculate the mean. The nine bar graphs correspond to 1) to 9) in (A). (C) Coefficient of variation (CV) of the repeat lengths of the nine samples. CV is defined as the ratio of the standard deviation (SD) to the mean. The original lengths before being grouped in bins were used to calculate the SD. The nine bar graphs correspond to 1) to 9) in (A). (D) The distribution of the CTG repeats in undifferentiated MyoD-iPSCs and in myocytes differentiated from the undifferentiated MyoD-iPSCs at early (passages 20–26), middle (passages 29–36) and late passage numbers (passages 40–48), following the strategy shown in Fig. 1A, right. The lengths of the CTG repeats were grouped in bins spanning 50 repeats. Student’s t-test was applied to each group of different CTG repeat lengths before being grouped in bins. P-values are shown. Because of the multiple comparison, the appropriate significance level was determined by Bonferroni correction, requiring a P ≤ 0.0083 to be significant at the 95% level. P stands for P-values. (E,F) Mean and CV repeat lengths of six samples. The six bar graphs correspond to 1) to 6) in (D).

