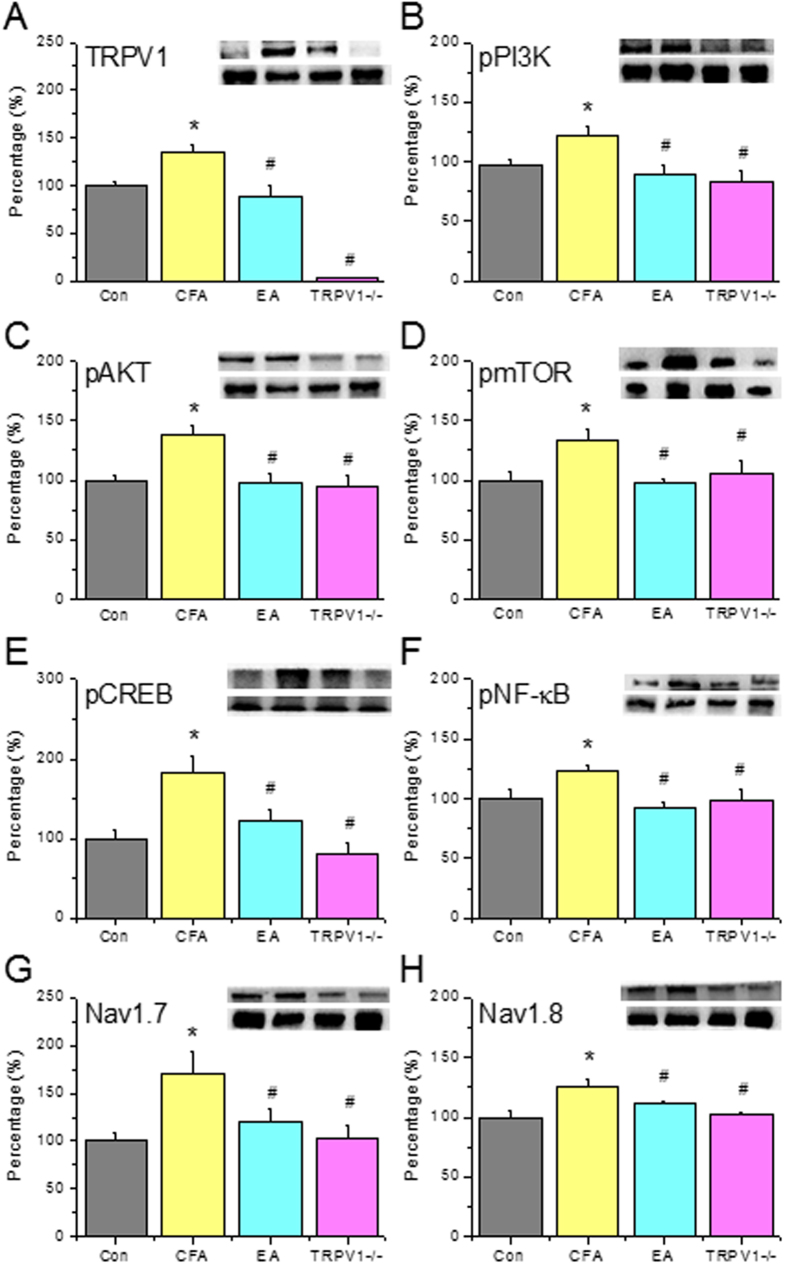
Figure 5. Expression levels of TRPV1 and associated signaling pathway proteins in SCDH after CFA injection, EA treatment and TRPV1 gene deletion.
(A) TRPV1, (B) pPI3K, (C) pAkt, (D) pmTOR, (E) pCREB, (F) pNFκB, (G) Nav1.7, and (H) Nav1.8. *p < 0.05 means comparison with Control group; #p < 0.05 means comparison with CFA group.

