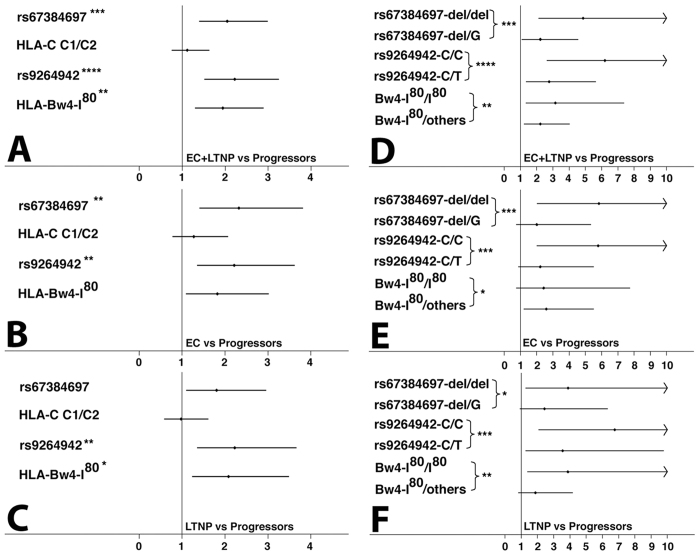
Figure 3. Effect of chromosome 6 genetic polymorphisms on HIV control.
The estimate of the risk was calculated comparing EC and/or LTNP vs HIV-1 + P. Panels (A–C) show the odds ratio and 95% confidence interval considering an additive allelic genetic model. The asterisk indicates bonferroni corrected significant p-values (*p < 0.05, **p < 0.01, ***p < 0.001, ****p < 0.0001). Panels (D–F) show the odds ratio and 95% confidence intervals considering a genotypic genetic model (presence of two copies or one copy of the risk allele vs no copies). The asterisk indicate chi-square test for trend p-value for the statistically significant polymorphism:(*p < 0.05, **p < 0.01, ***p < 0.001, ****p < 0.0001).

