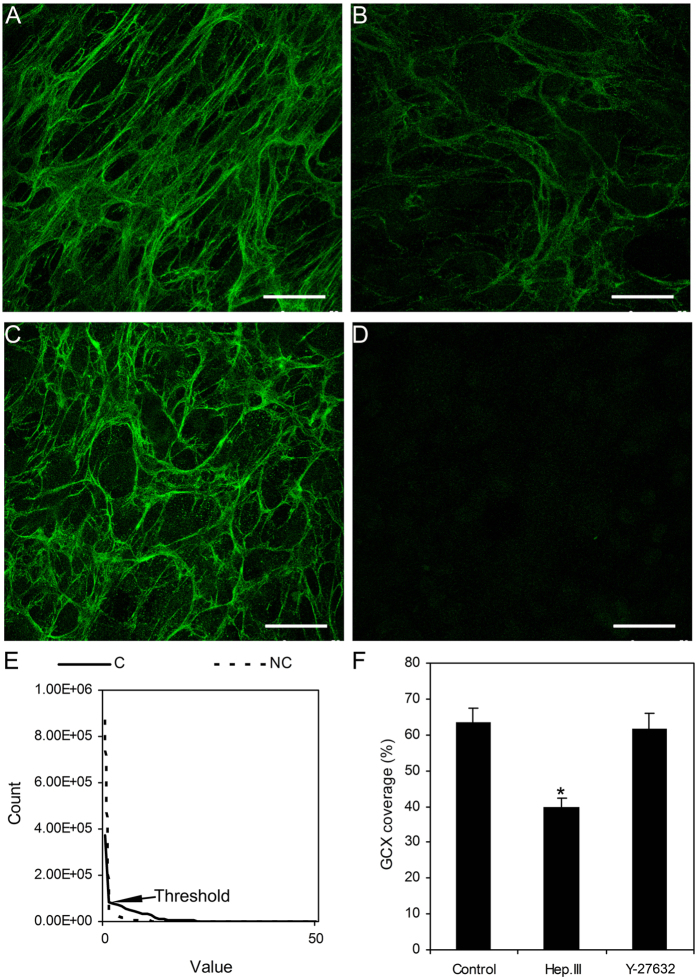
Figure 3. Immunofluorescence images of heparan sulfate proteoglycans on the surfaces of HUVSMCs with and without treatment.
(A) Control represents without enzymatic treatment. (B) 0.2 U/ml Hep.III treated for 1 hour. (C) 10 μM Y-27632 treated for 1 hour. (D) Negative control. (E) The Count-Value curves from the max-intensity Z-projection images of both control and negative control. The non-zero point of intersection between the curves was defined as the background threshold. The coverage of HS was defined as the area with values equal or higher than threshold divided by the total area and presented as a percent. F: The coverage of GCX for control, Hep.III or Y-27632 treated cells. Scale bar: 50 μm. (C) Control. NC: Negative control. GCX: glycocalyx. *P < 0.05 vs. control.

