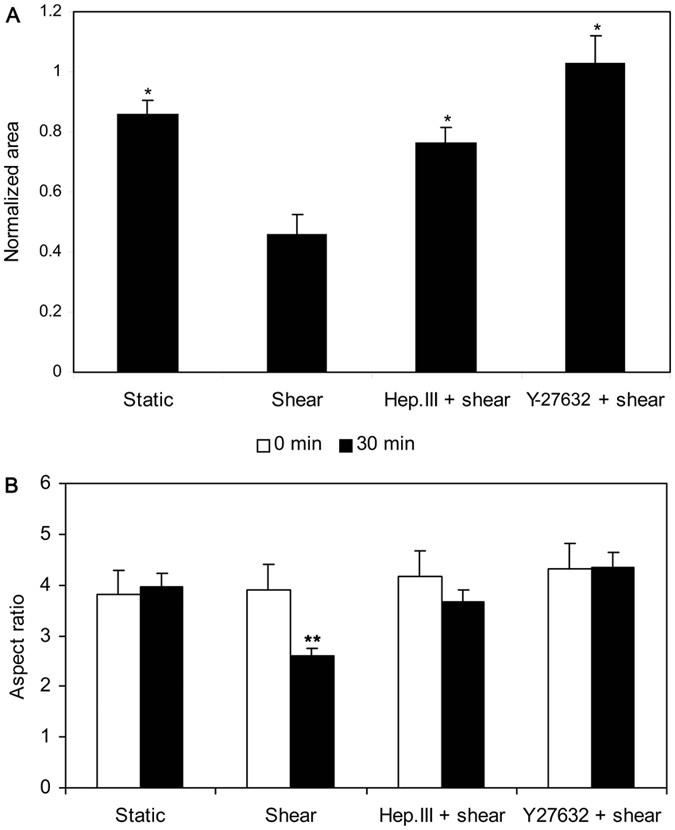
Figure 6.

(A) Normalized cell area after 30 min static or 20 dyn/cm2 shear stress exposure with or without Hep.III or Y-27632 treatment. Cell areas were normalized to the mean value at time 0. (B) The aspect ratio of HUVSMCs after 30 min static or 20 dyn/cm2 shear stress exposure with or without Hep.III or Y-27632 treatment. 100–300 cells from 5–9 images were analyzed. Data from 4 independent experiments were used to calculate the final mean value ± SEM. *P < 0.05 vs. shear. **P < 0.01 vs. 0 min (Shear).
