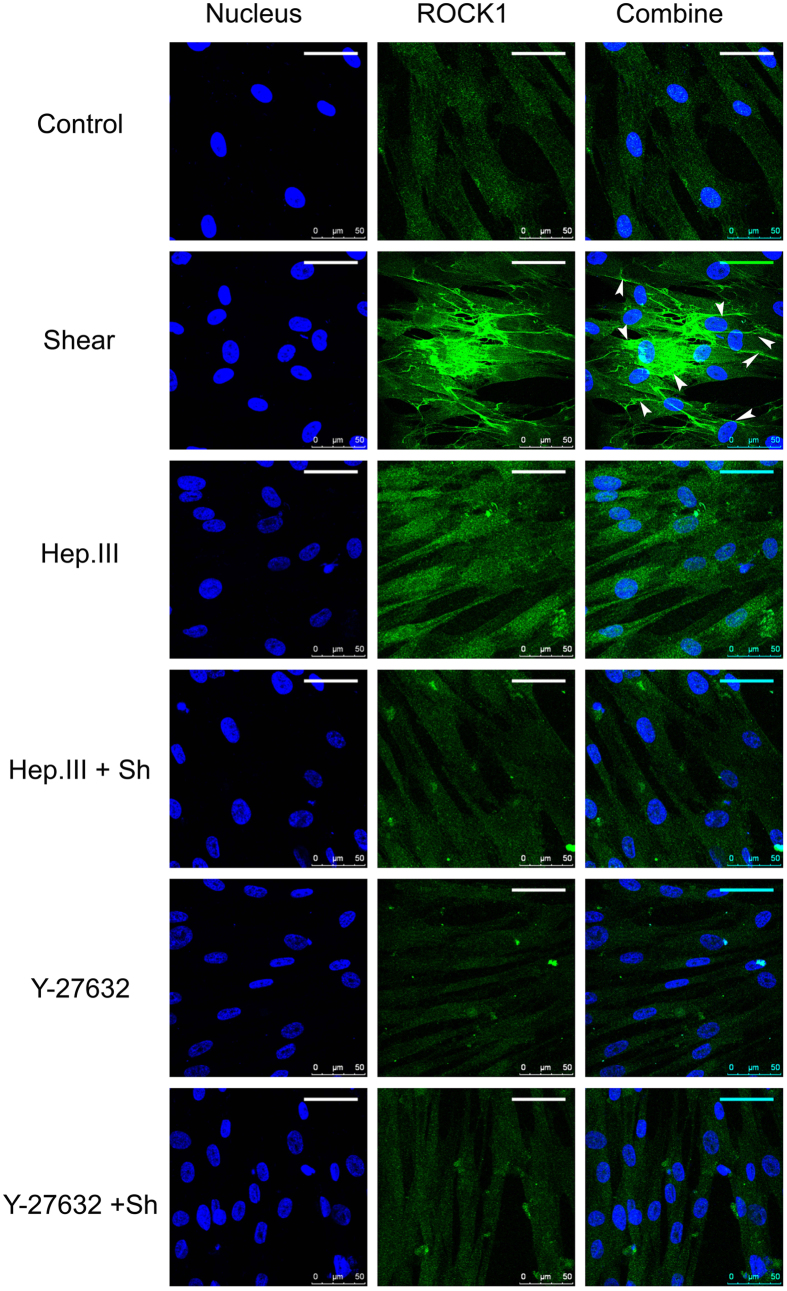
Figure 7. HUVSMCs co-stained with DAPI (nucleus, blue) and ROCK1 antibody (green).
Cells were divided into the following 6 groups: control (without treatment and no shear), shear (without treatment but 30-min 20 dyn/cm2 shear stress exposure), Hep.III (0.2 U/ml Hep.III treated and no shear), Hep.III + sh (0.2 U/ml Hep.III treated then exposed to shear), Y-27632 (10 μM Y-27632 treated and no shear), and Y-27632 + sh (10 μM Y-27632 treated then exposed to shear). Scale bar: 50 μm. Arrowheads denote ROCK1 distributed on the cell border.

