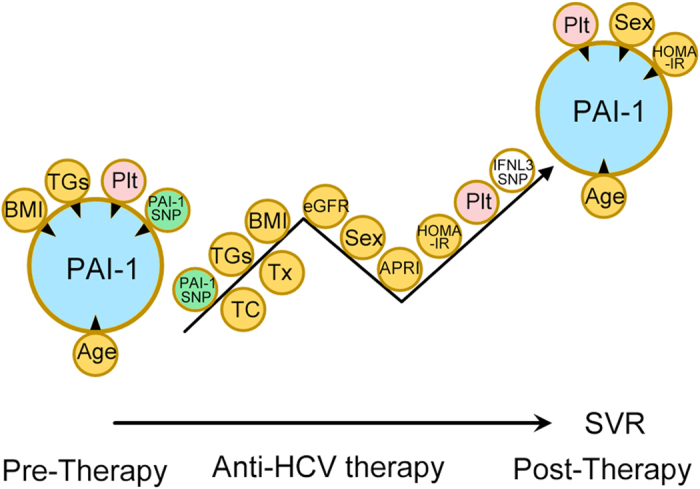
Figure 2. Associations between independent factors and plasminogen activator inhibitor-1 (PAI-1) levels in pre-, peri- and post-anti-hepatitis C virus therapy stages.

The tips of the black arrowheads indicate dependent factors, and the bases of the black arrowheads indicate independent factors. BMI: body mass index; TGs: triglycerides; Plt: platelet; PAI-1 SNP: PAI-1-rs-1799889 genotype; TC: total cholesterol; Tx: anti-HCV therapy; eGFR: estimated glomerular filtration rate; Sex: male sex; APRI: aspartate aminotransferase to platelet ratio index; HOMA-IR: homeostasis model assessment-estimated insulin resistance; IFNL3: interferon λ3; TC: total cholesterol.
