
Figure 1. Expression profiles of candidate reference genes in N. lugens.
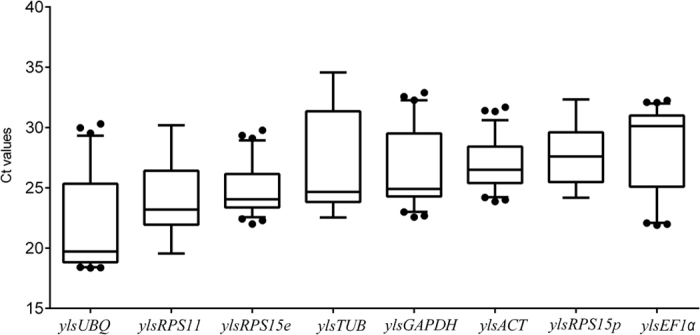
The expression level of candidate references in all tested samples are documented in Ct-value, and showed as boxplot. The dot indicates the maximum or minimum value of Ct, while whiskers indicate the standard error (SE) of the mean.