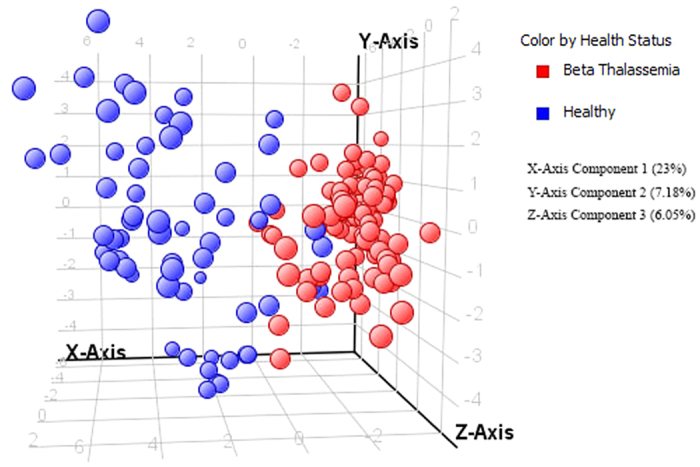
Figure 2. PCA score plot of healthy and β-thalassemia patients based on forty (40) significantly differentiated metabolites i.e. having a fold change >1.5.

Variance on X, Y and Z axis is also shown within brackets.

Variance on X, Y and Z axis is also shown within brackets.