
Figure 2. Symptom development following the different treatments (CK, untreated plants (control); NSY50, plants challenged with NSY50 (2.5 × 10⁸ CFU/mL); FOC, plants challenged with FOC (1 × 10⁸ CFU/mL); NSY50 + FOC: plants challenged with NSY50 for 3 days and then with FOC) on cucumber growth on the 30th day after FOC inoculation.
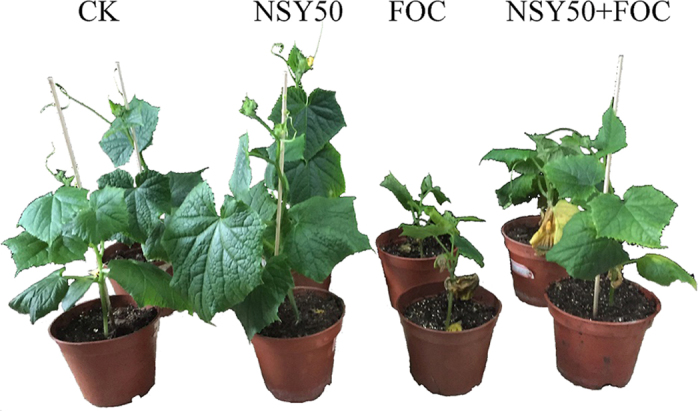
The pictures are representative of two independent biological experiments.