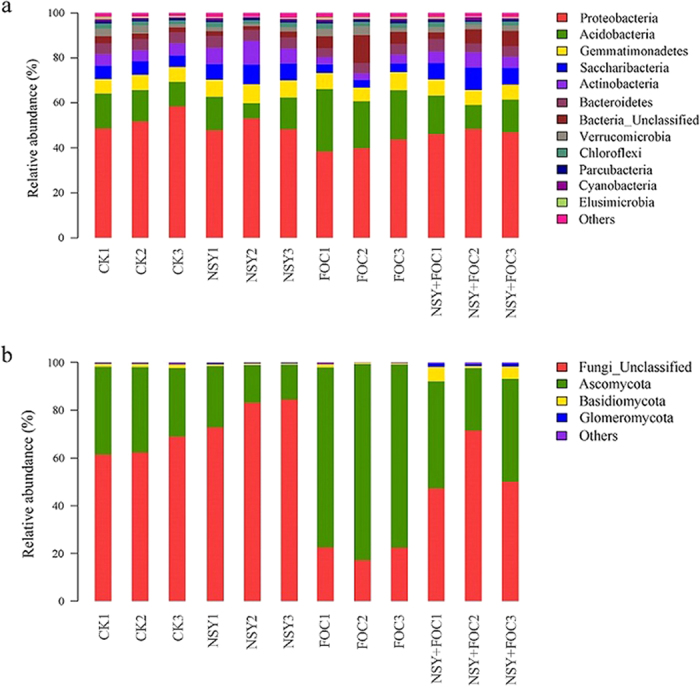
Figure 5.

The relative abundance of the dominant bacterial phyla (a) and fungal phyla (b) for soil samples collected from the four treatment conditions (CK, untreated plants (control); NSY50, plants challenged with NSY50 (2.5 × 10⁸ CFU/mL); FOC, plants challenged with FOC (1 × 10⁸ CFU/mL); NSY50 + FOC: plants challenged with NSY50 for 3 days and then with FOC). The relative abundance was based on the proportional frequencies of those DNA sequences that could be classified at the phylum level. Note: the different numbers (1, 2, 3) after the letters of all treatments indicate the three replications, and the letters NSY in the graph replace NSY50 to avoid confusion.
