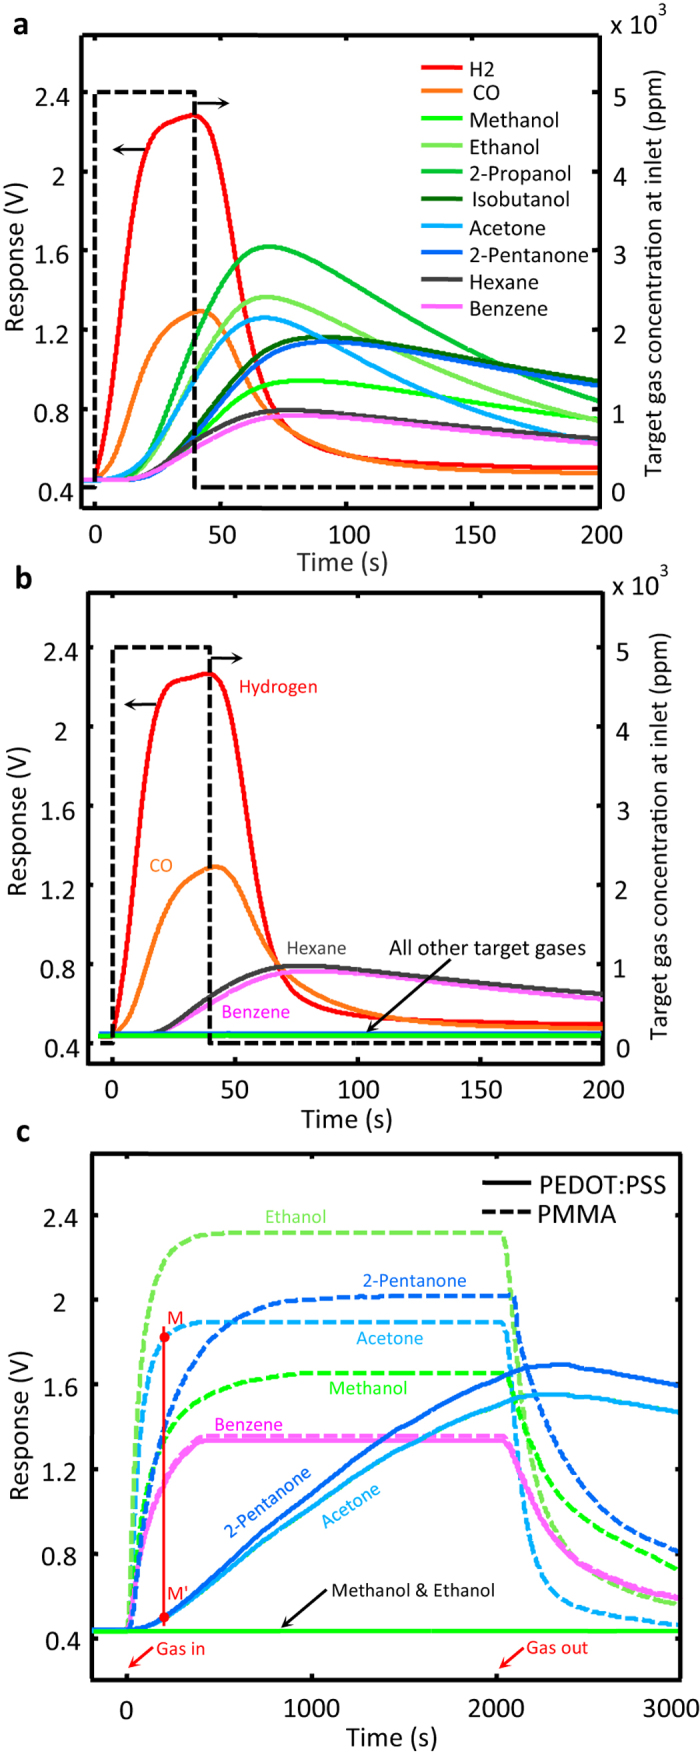
Figure 2. Temporal sensor responses.

Recorded for the stated contaminants using the control (a) and the coated (b) channels with 40 s exposure times; long-term (2000 s) exposure results for both devices are presented in (c). The red vertical line in (c) is drawn for determining the filtering power of the device with respect to acetone; the result is Facet. = 30.
