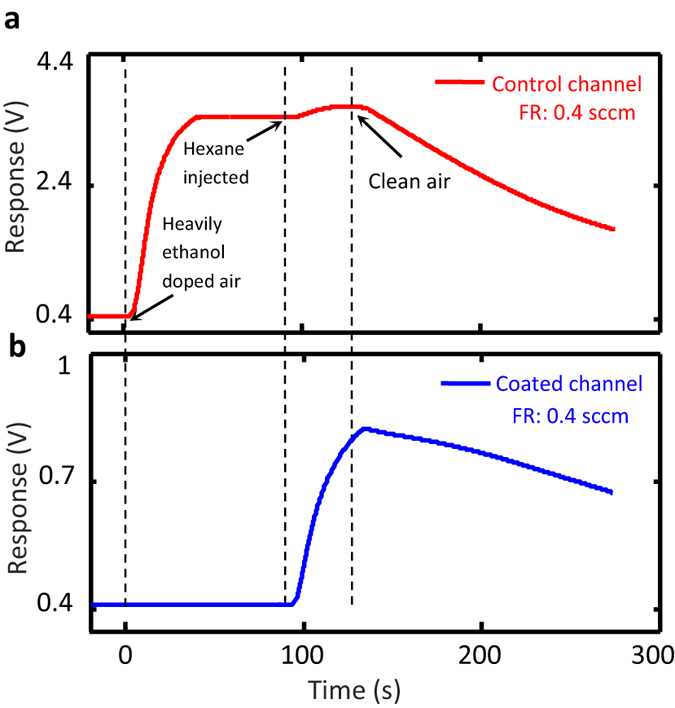
Figure 4. Demonstration of the selective flow of contaminants through the coated microchannel.

The temporal responses of the gas sensors located at the ends of the control (a) and the coated (b) microchannels upon establishing a continuous flow of 10000 ppm ethanol-contaminated air at t = 0 through them; in both cases, 1000 ppm of hexane is introduced to the test chamber at t = 90 s.
